The way ahead? - Vodafone
The way ahead? - Vodafone
The way ahead? - Vodafone

Create successful ePaper yourself
Turn your PDF publications into a flip-book with our unique Google optimized e-Paper software.
156<br />
<strong>Vodafone</strong> Group Plc<br />
Annual Report 2013<br />
Other unaudited financial information (continued)<br />
Liquidity and capital resources (continued)<br />
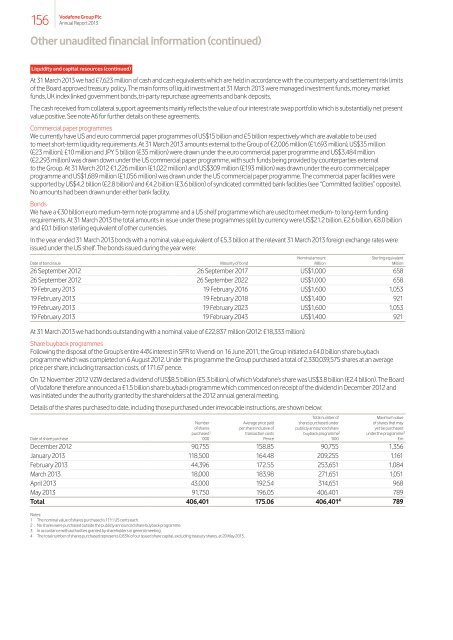
At 31 March 2013 we had £7,623 million of cash and cash equivalents which are held in accordance with the counterparty and settlement risk limits<br />
of the Board approved treasury policy. <strong>The</strong> main forms of liquid investment at 31 March 2013 were managed investment funds, money market<br />
funds, UK index linked government bonds, tri-party repurchase agreements and bank deposits.<br />
<strong>The</strong> cash received from collateral support agreements mainly reflects the value of our interest rate swap portfolio which is substantially net present<br />
value positive. See note A6 for further details on these agreements.<br />
Commercial paper programmes<br />
We currently have US and euro commercial paper programmes of US$15 billion and £5 billion respectively which are available to be used<br />
to meet short-term liquidity requirements. At 31 March 2013 amounts external to the Group of €2,006 million (£1,693 million), US$35 million<br />
(£23 million), £10 million and JPY 5 billion (£35 million) were drawn under the euro commercial paper programme and US$3,484 million<br />
(£2,293 million) was drawn down under the US commercial paper programme, with such funds being provided by counterparties external<br />
to the Group. At 31 March 2012 €1,226 million (£1,022 million) and US$309 million (£193 million) was drawn under the euro commercial paper<br />
programme and US$1,689 million (£1,056 million) was drawn under the US commercial paper programme. <strong>The</strong> commercial paper facilities were<br />
supported by US$4.2 billion (£2.8 billion) and €4.2 billion (£3.6 billion) of syndicated committed bank facilities (see “Committed facilities” opposite).<br />
No amounts had been drawn under either bank facility.<br />
Bonds<br />
We have a €30 billion euro medium-term note programme and a US shelf programme which are used to meet medium- to long-term funding<br />
requirements. At 31 March 2013 the total amounts in issue under these programmes split by currency were US$21.2 billion, £2.6 billion, €8.0 billion<br />
and £0.1 billion sterling equivalent of other currencies.<br />
In the year ended 31 March 2013 bonds with a nominal value equivalent of £5.3 billion at the relevant 31 March 2013 foreign exchange rates were<br />
issued under the US shelf. <strong>The</strong> bonds issued during the year were:<br />
Date of bond issue Maturity of bond<br />
Nominal amount<br />
Million<br />
Sterling equivalent<br />
Million<br />
26 September 2012 26 September 2017 US$1,000 658<br />
26 September 2012 26 September 2022 US$1,000 658<br />
19 February 2013 19 February 2016 US$1,600 1,053<br />
19 February 2013 19 February 2018 US$1,400 921<br />
19 February 2013 19 February 2023 US$1,600 1,053<br />
19 February 2013 19 February 2043 US$1,400 921<br />
At 31 March 2013 we had bonds outstanding with a nominal value of £22,837 million (2012: £18,333 million).<br />
Share buyback programmes<br />
Following the disposal of the Group’s entire 44% interest in SFR to Vivendi on 16 June 2011, the Group initiated a £4.0 billion share buyback<br />
programme which was completed on 6 August 2012. Under this programme the Group purchased a total of 2,330,039,575 shares at an average<br />
price per share, including transaction costs, of 171.67 pence.<br />
On 12 November 2012 VZW declared a dividend of US$8.5 billion (£5.3 billion), of which <strong>Vodafone</strong>’s share was US$3.8 billion (£2.4 billion). <strong>The</strong> Board<br />
of <strong>Vodafone</strong> therefore announced a £1.5 billion share buyback programme which commenced on receipt of the dividend in December 2012 and<br />
was initiated under the authority granted by the shareholders at the 2012 annual general meeting.<br />
Details of the shares purchased to date, including those purchased under irrevocable instructions, are shown below:<br />
Number<br />
of shares<br />
purchased 1<br />
Average price paid<br />
per share inclusive of<br />
transaction costs<br />
Total number of<br />
shares purchased under<br />
publicly announced share<br />
buyback programme 2<br />
Maximum value<br />
of shares that may<br />
yet be purchased<br />
under the programme 3<br />
Date of share purchase ’000 Pence ’000 £m<br />
December 2012 90,755 158.85 90,755 1,356<br />
January 2013 118,500 164.48 209,255 1,161<br />
February 2013 44,396 172.55 253,651 1,084<br />
March 2013 18,000 183.98 271,651 1,051<br />
April 2013 43,000 192.54 314,651 968<br />
May 2013 91,750 196.05 406,401 789<br />
Total 406,401 175.06 406,401 4 789<br />
Notes:<br />
1 <strong>The</strong> nominal value of shares purchased is 11 3 /7 US cents each.<br />
2 No shares were purchased outside the publicly announced share buyback programme.<br />
3 In accordance with authorities granted by shareholders in general meeting.<br />
4 <strong>The</strong> total number of shares purchased represents 0.83% of our issued share capital, excluding treasury shares, at 20 May 2013.