The way ahead? - Vodafone
The way ahead? - Vodafone
The way ahead? - Vodafone

Create successful ePaper yourself
Turn your PDF publications into a flip-book with our unique Google optimized e-Paper software.
144<br />
<strong>Vodafone</strong> Group Plc<br />
Annual Report 2013<br />
Notes to the consolidated financial statements (continued)<br />
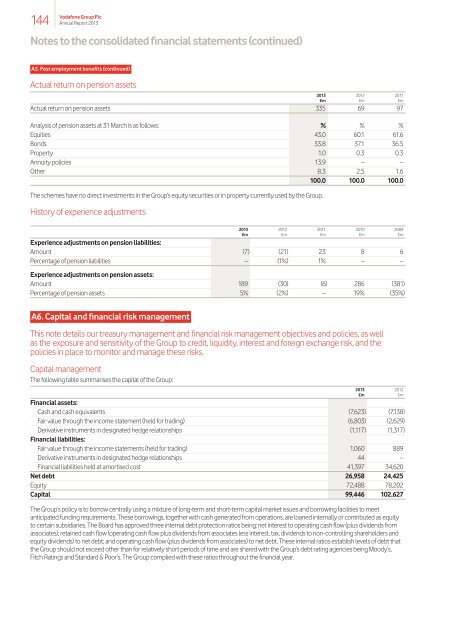
A5. Post employment benefits (continued)<br />
Actual return on pension assets<br />
2013 2012 2011<br />
£m £m £m<br />
Actual return on pension assets 335 69 97<br />
Analysis of pension assets at 31 March is as follows: % % %<br />
Equities 43.0 60.1 61.6<br />
Bonds 33.8 37.1 36.5<br />
Property 1.0 0.3 0.3<br />
Annuity policies 13.9 – –<br />
Other 8.3 2.5 1.6<br />
100.0 100.0 100.0<br />
<strong>The</strong> schemes have no direct investments in the Group’s equity securities or in property currently used by the Group.<br />
History of experience adjustments<br />
2013 2012 2011 2010 2009<br />
£m £m £m £m £m<br />
Experience adjustments on pension liabilities:<br />
Amount (7) (21) 23 8 6<br />
Percentage of pension liabilities – (1%) 1% – –<br />
Experience adjustments on pension assets:<br />
Amount 189 (30) (6) 286 (381)<br />
Percentage of pension assets 5% (2%) – 19% (35%)<br />
A6. Capital and financial risk management<br />
This note details our treasury management and financial risk management objectives and policies, as well<br />
as the exposure and sensitivity of the Group to credit, liquidity, interest and foreign exchange risk, and the<br />
policies in place to monitor and manage these risks.<br />
Capital management<br />
<strong>The</strong> following table summarises the capital of the Group:<br />
2013 2012<br />
£m £m<br />
Financial assets:<br />
Cash and cash equivalents (7,623) (7,138)<br />
Fair value through the income statement (held for trading) (6,803) (2,629)<br />
Derivative instruments in designated hedge relationships (1,117) (1,317)<br />
Financial liabilities:<br />
Fair value through the income statements (held for trading) 1,060 889<br />
Derivative instruments in designated hedge relationships 44 –<br />
Financial liabilities held at amortised cost 41,397 34,620<br />
Net debt 26,958 24,425<br />
Equity 72,488 78,202<br />
Capital 99,446 102,627<br />
<strong>The</strong> Group’s policy is to borrow centrally using a mixture of long-term and short-term capital market issues and borrowing facilities to meet<br />
anticipated funding requirements. <strong>The</strong>se borrowings, together with cash generated from operations, are loaned internally or contributed as equity<br />
to certain subsidiaries. <strong>The</strong> Board has approved three internal debt protection ratios being: net interest to operating cash flow (plus dividends from<br />
associates); retained cash flow (operating cash flow plus dividends from associates less interest, tax, dividends to non-controlling shareholders and<br />
equity dividends) to net debt; and operating cash flow (plus dividends from associates) to net debt. <strong>The</strong>se internal ratios establish levels of debt that<br />
the Group should not exceed other than for relatively short periods of time and are shared with the Group’s debt rating agencies being Moody’s,<br />
Fitch Ratings and Standard & Poor’s. <strong>The</strong> Group complied with these ratios throughout the financial year.