The way ahead? - Vodafone
The way ahead? - Vodafone
The way ahead? - Vodafone

Create successful ePaper yourself
Turn your PDF publications into a flip-book with our unique Google optimized e-Paper software.
Overview<br />
Business<br />
review Performance Governance Financials<br />
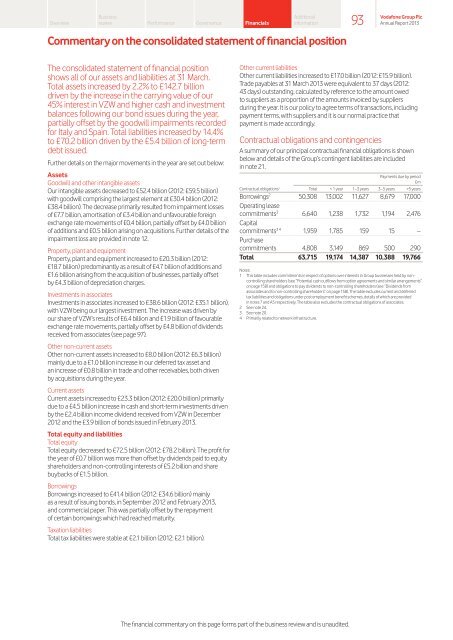
Commentary on the consolidated statement of financial position<br />
<strong>The</strong> consolidated statement of financial position<br />
shows all of our assets and liabilities at 31 March.<br />
Total assets increased by 2.2% to £142.7 billion<br />
driven by the increase in the carrying value of our<br />
45% interest in VZW and higher cash and investment<br />
balances following our bond issues during the year,<br />
partially offset by the goodwill impairments recorded<br />
for Italy and Spain. Total liabilities increased by 14.4%<br />
to £70.2 billion driven by the £5.4 billion of long‑term<br />
debt issued.<br />
Further details on the major movements in the year are set out below:<br />
Assets<br />
Goodwill and other intangible assets<br />
Our intangible assets decreased to £52.4 billion (2012: £59.5 billion)<br />
with goodwill comprising the largest element at £30.4 billion (2012:<br />
£38.4 billion). <strong>The</strong> decrease primarily resulted from impairment losses<br />
of £7.7 billion, amortisation of £3.4 billion and unfavourable foreign<br />
exchange rate movements of £0.4 billion, partially offset by £4.0 billion<br />
of additions and £0.5 billion arising on acquisitions. Further details of the<br />
impairment loss are provided in note 12.<br />
Property, plant and equipment<br />
Property, plant and equipment increased to £20.3 billion (2012:<br />
£18.7 billion) predominantly as a result of £4.7 billion of additions and<br />
£1.6 billion arising from the acquisition of businesses, partially offset<br />
by £4.3 billion of depreciation charges.<br />
Investments in associates<br />
Investments in associates increased to £38.6 billion (2012: £35.1 billion),<br />
with VZW being our largest investment. <strong>The</strong> increase was driven by<br />
our share of VZW’s results of £6.4 billion and £1.9 billion of favourable<br />
exchange rate movements, partially offset by £4.8 billion of dividends<br />
received from associates (see page 97).<br />
Other non-current assets<br />
Other non‑current assets increased to £8.0 billion (2012: £6.3 billion)<br />
mainly due to a £1.0 billion increase in our deferred tax asset and<br />
an increase of £0.8 billion in trade and other receivables, both driven<br />
by acquisitions during the year.<br />
Current assets<br />
Current assets increased to £23.3 billion (2012: £20.0 billion) primarily<br />
due to a £4.5 billion increase in cash and short‑term investments driven<br />
by the £2.4 billion income dividend received from VZW in December<br />
2012 and the £3.9 billion of bonds issued in February 2013.<br />
Total equity and liabilities<br />
Total equity<br />
Total equity decreased to £72.5 billion (2012: £78.2 billion). <strong>The</strong> profit for<br />
the year of £0.7 billion was more than offset by dividends paid to equity<br />
shareholders and non‑controlling interests of £5.2 billion and share<br />
buybacks of £1.5 billion.<br />
Borrowings<br />
Borrowings increased to £41.4 billion (2012: £34.6 billion) mainly<br />
as a result of issuing bonds, in September 2012 and February 2013,<br />
and commercial paper. This was partially offset by the repayment<br />
of certain borrowings which had reached maturity.<br />
Taxation liabilities<br />
Total tax liabilities were stable at £2.1 billion (2012: £2.1 billion).<br />
Additional<br />
information<br />
Other current liabilities<br />
Other current liabilities increased to £17.0 billion (2012: £15.9 billion).<br />
Trade payables at 31 March 2013 were equivalent to 37 days (2012:<br />
43 days) outstanding, calculated by reference to the amount owed<br />
to suppliers as a proportion of the amounts invoiced by suppliers<br />
during the year. It is our policy to agree terms of transactions, including<br />
payment terms, with suppliers and it is our normal practice that<br />
payment is made accordingly.<br />
Contractual obligations and contingencies<br />
A summary of our principal contractual financial obligations is shown<br />
below and details of the Group’s contingent liabilities are included<br />
in note 21.<br />
Payments due by period<br />
£m<br />
Contractual obligations 1 Total < 1 year 1–3 years 3–5 years >5 years<br />
Borrowings2 Operating lease<br />
50,308 13,002 11,627 8,679 17,000<br />
commitments3 Capital<br />
6,640 1,238 1,732 1,194 2,476<br />
commitments3 4 Purchase<br />
1,959 1,785 159 15 –<br />
commitments 4,808 3,149 869 500 290<br />
Total 63,715 19,174 14,387 10,388 19,766<br />
Notes:<br />
1 This table includes commitments in respect of options over interests in Group businesses held by non‑<br />
controlling shareholders (see “Potential cash outflows from option agreements and similar arrangements”<br />
on page 158) and obligations to pay dividends to non-controlling shareholders (see “Dividends from<br />
associates and to non‑controlling shareholders” on page 158). <strong>The</strong> table excludes current and deferred<br />
tax liabilities and obligations under post employment benefit schemes, details of which are provided<br />
in notes 7 and A5 respectively. <strong>The</strong> table also excludes the contractual obligations of associates.<br />
2 See note 24.<br />
3 See note 20.<br />
4 Primarily related to network infrastructure.<br />
<strong>The</strong> financial commentary on this page forms part of the business review and is unaudited.<br />
93<br />
<strong>Vodafone</strong> Group Plc<br />
Annual Report 2013