The way ahead? - Vodafone
The way ahead? - Vodafone
The way ahead? - Vodafone

You also want an ePaper? Increase the reach of your titles
YUMPU automatically turns print PDFs into web optimized ePapers that Google loves.
Overview<br />
Business<br />
review Performance Governance Financials<br />
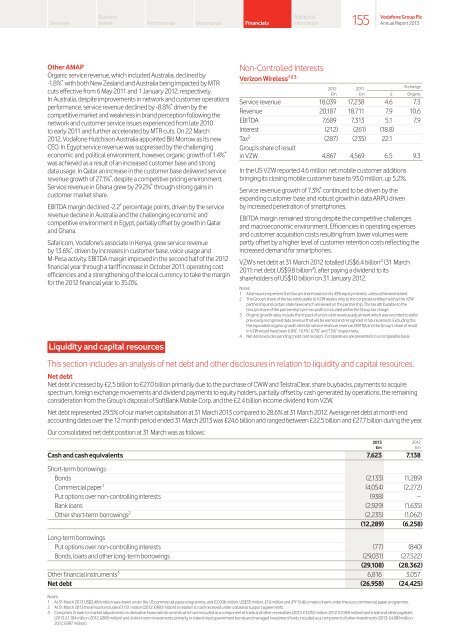
Other AMAP<br />
Organic service revenue, which included Australia, declined by<br />
-1.8% * with both New Zealand and Australia being impacted by MTR<br />
cuts effective from 6 May 2011 and 1 January 2012, respectively.<br />
In Australia, despite improvements in network and customer operations<br />
performance, service revenue declined by -8.8% * driven by the<br />
competitive market and weakness in brand perception following the<br />
network and customer service issues experienced from late 2010<br />
to early 2011 and further accelerated by MTR cuts. On 22 March<br />
2012, <strong>Vodafone</strong> Hutchison Australia appointed Bill Morrow as its new<br />
CEO. In Egypt service revenue was suppressed by the challenging<br />
economic and political environment, however, organic growth of 1.4% *<br />
was achieved as a result of an increased customer base and strong<br />
data usage. In Qatar an increase in the customer base delivered service<br />
revenue growth of 27.1% * , despite a competitive pricing environment.<br />
Service revenue in Ghana grew by 29.2% * through strong gains in<br />
customer market share.<br />
EBITDA margin declined -2.2 * percentage points, driven by the service<br />
revenue decline in Australia and the challenging economic and<br />
competitive environment in Egypt, partially offset by growth in Qatar<br />
and Ghana.<br />
Safaricom, <strong>Vodafone</strong>’s associate in Kenya, grew service revenue<br />
by 13.6% * , driven by increases in customer base, voice usage and<br />
M-Pesa activity. EBITDA margin improved in the second half of the 2012<br />
financial year through a tariff increase in October 2011, operating cost<br />
efficiencies and a strengthening of the local currency to take the margin<br />
for the 2012 financial year to 35.0%.<br />
Liquidity and capital resources<br />
Additional<br />
information<br />
Non-Controlled Interests<br />
Verizon Wireless 1 2 3<br />
2012<br />
£m<br />
2011<br />
£m<br />
% change<br />
£ Organic<br />
Service revenue 18,039 17,238 4.6 7.3<br />
Revenue 20,187 18,711 7.9 10.6<br />
EBITDA 7,689 7,313 5.1 7.9<br />
Interest (212) (261) (18.8)<br />
Tax 2 (287) (235) 22.1<br />
Group’s share of result<br />
in VZW 4,867 4,569 6.5 9.3<br />
In the US VZW reported 4.6 million net mobile customer additions<br />
bringing its closing mobile customer base to 93.0 million, up 5.2%.<br />
Service revenue growth of 7.3% * continued to be driven by the<br />
expanding customer base and robust growth in data ARPU driven<br />
by increased penetration of smartphones.<br />
EBITDA margin remained strong despite the competitive challenges<br />
and macroeconomic environment. Efficiencies in operating expenses<br />
and customer acquisition costs resulting from lower volumes were<br />
partly offset by a higher level of customer retention costs reflecting the<br />
increased demand for smartphones.<br />
VZW’s net debt at 31 March 2012 totalled US$6.4 billion 4 (31 March<br />
2011: net debt US$9.8 billion 4 ), after paying a dividend to its<br />
shareholders of US$10 billion on 31 January 2012.<br />
Notes:<br />
1 All amounts represent the Group’s share based on its 45% equity interest, unless otherwise stated.<br />
2 <strong>The</strong> Group’s share of the tax attributable to VZW relates only to the corporate entities held by the VZW<br />
partnership and certain state taxes which are levied on the partnership. <strong>The</strong> tax attributable to the<br />
Group’s share of the partnership’s pre-tax profit is included within the Group tax charge.<br />
3 Organic growth rates include the impact of a non-cash revenue adjustment which was recorded to defer<br />
previously recognised data revenue that will be earned and recognised in future periods. Excluding this<br />
the equivalent organic growth rates for service revenue, revenue, EBITDA and the Group’s share of result<br />
in VZW would have been 6.8% * , 10.1% * , 6.7% * and 7.5% * respectively.<br />
4 Net debt excludes pending credit card receipts. Comparatives are presented on a comparable basis.<br />
This section includes an analysis of net debt and other disclosures in relation to liquidity and capital resources.<br />
Net debt<br />
Net debt increased by £2.5 billion to £27.0 billion primarily due to the purchase of CWW and TelstraClear, share buybacks, payments to acquire<br />
spectrum, foreign exchange movements and dividend payments to equity holders, partially offset by cash generated by operations, the remaining<br />
consideration from the Group’s disposal of SoftBank Mobile Corp. and the £2.4 billion income dividend from VZW.<br />
Net debt represented 29.5% of our market capitalisation at 31 March 2013 compared to 28.6% at 31 March 2012. Average net debt at month end<br />
accounting dates over the 12 month period ended 31 March 2013 was £24.6 billion and ranged between £22.5 billion and £27.7 billion during the year.<br />
Our consolidated net debt position at 31 March was as follows:<br />
2013 2012<br />
£m £m<br />
Cash and cash equivalents 7,623 7,138<br />
Short-term borrowings<br />
Bonds (2,133) (1,289)<br />
Commercial paper 1 (4,054) (2,272)<br />
Put options over non-controlling interests (938) –<br />
Bank loans (2,929) (1,635)<br />
Other short-term borrowings 2 (2,235) (1,062)<br />
(12,289) (6,258)<br />
Long-term borrowings<br />
Put options over non-controlling interests (77) (840)<br />
Bonds, loans and other long-term borrowings (29,031) (27,522)<br />
(29,108) (28,362)<br />
Other financial instruments 3 6,816 3,057<br />
Net debt (26,958) (24,425)<br />
155<br />
<strong>Vodafone</strong> Group Plc<br />
Annual Report 2013<br />
Notes:<br />
1 At 31 March 2013 US$3,484 million was drawn under the US commercial paper programme, and €2,006 million, US$35 million, £10 million and JPY 5 billion were drawn under the euro commercial paper programme.<br />
2 At 31 March 2013 the amount includes £1,151 million (2012: £980 million) in relation to cash received under collateral support agreements.<br />
3 Comprises i) mark-to-market adjustments on derivative financial instruments which are included as a component of trade and other receivables (2013: £3,032 million; 2012: £2,959 million) and trade and other payables<br />
(2013: £1,104 million; 2012: £889 million) and ii) short-term investments primarily in index linked government bonds and managed investment funds included as a component of other investments (2013: £4,888 million;<br />
2012: £987 million).