The way ahead? - Vodafone
The way ahead? - Vodafone
The way ahead? - Vodafone

Create successful ePaper yourself
Turn your PDF publications into a flip-book with our unique Google optimized e-Paper software.
40<br />
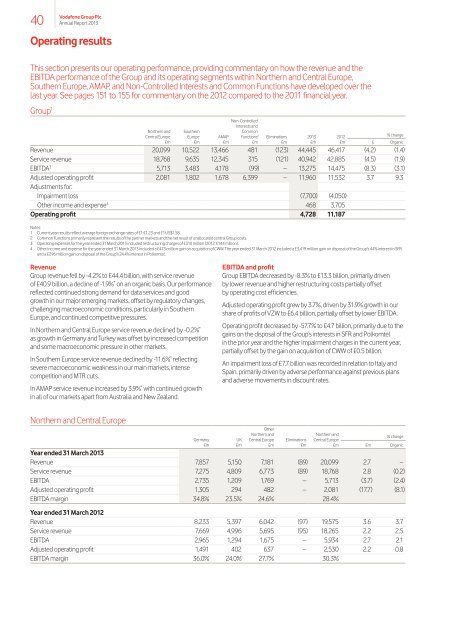
This section presents our operating performance, providing commentary on how the revenue and the<br />
EBITDA performance of the Group and its operating segments within Northern and Central Europe,<br />
Southern Europe, AMAP, and Non-Controlled Interests and Common Functions have developed over the<br />
last year. See pages 151 to 155 for commentary on the 2012 compared to the 2011 financial year.<br />
Group 1<br />
<strong>Vodafone</strong> Group Plc<br />
Annual Report 2013<br />
Operating results<br />
Northern and<br />
Central Europe<br />
£m<br />
Southern<br />
Europe<br />
£m<br />
AMAP<br />
£m<br />
Non-Controlled<br />
Interests and<br />
Common<br />
Functions 2<br />
£m<br />
Eliminations<br />
£m<br />
2013<br />
£m<br />
2012<br />
£m<br />
% change<br />
£ Organic<br />
Revenue 20,099 10,522 13,466 481 (123) 44,445 46,417 (4.2) (1.4)<br />
Service revenue 18,768 9,635 12,345 315 (121) 40,942 42,885 (4.5) (1.9)<br />
EBITDA 3 5,713 3,483 4,178 (99) – 13,275 14,475 (8.3) (3.1)<br />
Adjusted operating profit 2,081 1,802 1,678 6,399 – 11,960 11,532 3.7 9.3<br />
Adjustments for:<br />
Impairment loss (7,700) (4,050)<br />
Other income and expense 4 468 3,705<br />
Operating profit 4,728 11,187<br />
Notes:<br />
1 Current year results reflect average foreign exchange rates of £1:€1.23 and £1:US$1.58.<br />
2 Common Functions primarily represent the results of the partner markets and the net result of unallocated central Group costs.<br />
3 Operating expenses for the year ended 31 March 2013 included restructuring charges of £310 million (2012: £144 million).<br />
4 Other income and expense for the year ended 31 March 2013 included a £473 million gain on acquisition of CWW. <strong>The</strong> year ended 31 March 2012 included a £3,419 million gain on disposal of the Group’s 44% interest in SFR<br />
and a £296 million gain on disposal of the Group’s 24.4% interest in Polkomtel.<br />
Revenue<br />
Group revenue fell by -4.2% to £44.4 billion, with service revenue<br />
of £40.9 billion, a decline of -1.9% * on an organic basis. Our performance<br />
reflected continued strong demand for data services and good<br />
growth in our major emerging markets, offset by regulatory changes,<br />
challenging macroeconomic conditions, particularly in Southern<br />
Europe, and continued competitive pressures.<br />
In Northern and Central Europe service revenue declined by -0.2% *<br />
as growth in Germany and Turkey was offset by increased competition<br />
and some macroeconomic pressure in other markets.<br />
In Southern Europe service revenue declined by -11.6% * reflecting<br />
severe macroeconomic weakness in our main markets, intense<br />
competition and MTR cuts.<br />
In AMAP service revenue increased by 3.9% * with continued growth<br />
in all of our markets apart from Australia and New Zealand.<br />
Northern and Central Europe<br />
Germany<br />
£m<br />
EBITDA and profit<br />
Group EBITDA decreased by -8.3% to £13.3 billion, primarily driven<br />
by lower revenue and higher restructuring costs partially offset<br />
by operating cost efficiencies.<br />
Adjusted operating profit grew by 3.7%, driven by 31.9% growth in our<br />
share of profits of VZW to £6.4 billion, partially offset by lower EBITDA.<br />
Operating profit decreased by -57.7% to £4.7 billion, primarily due to the<br />
gains on the disposal of the Group’s interests in SFR and Polkomtel<br />
in the prior year and the higher impairment charges in the current year,<br />
partially offset by the gain on acquisition of CWW of £0.5 billion.<br />
An impairment loss of £7.7 billion was recorded in relation to Italy and<br />
Spain, primarily driven by adverse performance against previous plans<br />
and adverse movements in discount rates.<br />
UK<br />
£m<br />
Other<br />
Northern and<br />
Central Europe<br />
£m<br />
Eliminations<br />
£m<br />
Northern and<br />
Central Europe<br />
£m<br />
% change<br />
£m Organic<br />
Year ended 31 March 2013<br />
Revenue 7,857 5,150 7,181 (89) 20,099 2.7 –<br />
Service revenue 7,275 4,809 6,773 (89) 18,768 2.8 (0.2)<br />
EBITDA 2,735 1,209 1,769 – 5,713 (3.7) (2.4)<br />
Adjusted operating profit 1,305 294 482 – 2,081 (17.7) (8.1)<br />
EBITDA margin 34.8% 23.5% 24.6% 28.4%<br />
Year ended 31 March 2012<br />
Revenue 8,233 5,397 6,042 (97) 19,575 3.6 3.7<br />
Service revenue 7,669 4,996 5,695 (95) 18,265 2.2 2.5<br />
EBITDA 2,965 1,294 1,675 – 5,934 2.7 2.1<br />
Adjusted operating profit 1,491 402 637 – 2,530 2.2 0.8<br />
EBITDA margin 36.0% 24.0% 27.7% 30.3%