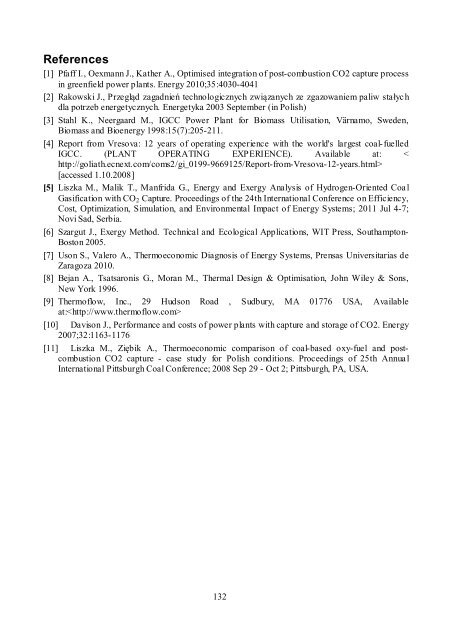
Flue Gas Stream number 255 37 20 1030 Sub cooled 175,4C 256 37 20 42,3 Sub cooled 175,4C 257 37 20 987,7 Sub cooled 175,4C 247 49,35 20 1030 Sub cooled 163C 248 62,6 20 1030 Sub cooled 149,8C T, C p, bar m, kg/s mash, kg/s 131 CO2 N2 H2O SO2 Ar O2 mole fractions 37 850 1,0427 95,41 1,241 14,44 71,11 10,40 0,007 38 323,13 1,0353 95,41 1,241 14,44 71,11 10,40 0,007 0,86 3,18 0,86 3,18 40 130,3 1,0328 98,83 1,241 13,93 71,34 10,06 0,007 0,86 3,8 44 130,3 1,0132 98,83 0,002 13,93 71,34 10,06 0,007 0,86 3,8 167 35 1,0132 76,65 0 1,71 87,68 4,88 0 1,06 4,67 218 30 130 18,49 0 99,97 0 0,03 0 0 0 Table A.3. Calculated parameters at selected points of the plant structure for reference CHP plant without CO2 capture case (point numbers correspond to those in Fig. A.3) Water/Steam Stream number Flue Gas Stream number T, C p, bar m, kg/s Quality 16 560 161 72,7 Superheated 212,1C 20 344,8 39,8 68,6 Superheated 94,8C 32 287,1 25,3 64,2 Superheated 62,6C 33 194,6 10,9 60,5 Superheated 10,9C 24 158,8 6 53,9 0,977 31 105,6 1,2 53,7 0,913 29 95 0,85 53,7 0,901 41 105,6 1,2 0,2 0,913 17 245 172,6 72,9 Sub cooled 108,5C 15 470 162,6 72,7 Superheated 121,3C T, C p, bar m, kg/s mash, kg/s CO2 N2 H2O SO2 Ar O2 mole fractions 5 850 1,0378 85,73 1,134 14,44 71,1 10,41 0,007 8 329 1,0303 85,73 1,134 14,44 71,1 10,41 0,007 0,86 3,18 0,86 3,18 66 130 1,0228 94,97 1,134 13,01 71,71 9,49 0,007 0,86 4,92 18 130 1,0132 94,97 0,002 13,01 71,71 9,49 0,007 0,86 4,92
References [1] Pfaff I., Oexmann J., Kather A., Optimised integration of post-combustion CO2 capture process in greenfield power plants. Energy 2010;35:4030-4041 [2] Rakowski J., Przegld zagadnie technologicznych zwizanych ze zgazowaniem paliw staych dla potrzeb energetycznych. Energetyka 2003 September (in Polish) [3] Stahl K., Neergaard M., IGCC Power Plant for Biomass Utilisation, Värnamo, Sweden, Biomass and Bioenergy 1998:15(7):205-21<strong>1.</strong> [4] Report from Vresova: 12 years of operating experience with the world's largest coal-fuelled IGCC. (PLANT OPERATING EXPERIENCE). Available at: < http://goliath.ecnext.com/coms2/gi_0199-9669125/Report-from-Vresova-12-years.html> [accessed <strong>1.</strong>10.2008] [5] Liszka M., Malik T., Manfrida G., Energy and Exergy Analysis of Hydrogen-Oriented Coal Gasification with CO2 Capture. Proceedings of the 24th International Conference on Efficiency, Cost, Optimization, Simulation, and Environmental Impact of Energy Systems; 2011 Jul 4-7; Novi Sad, Serbia. [6] Szargut J., Exergy Method. Technical and Ecological Applications, WIT <strong>Press</strong>, Southampton- Boston 2005. [7] Uson S., Valero A., Thermoeconomic Diagnosis of Energy Systems, Prensas Universitarias de Zaragoza 2010. [8] Bejan A., Tsatsaronis G., Moran M., Thermal Design & Optimisation, John Wiley & Sons, New York 1996. [9] Thermoflow, Inc., 29 Hudson Road , Sudbury, MA 01776 USA, Available at: [10] Davison J., Performance and costs of power plants with capture and storage of CO2. Energy 2007;32:1163-1176 [11] Liszka M., Zibik A., Thermoeconomic comparison of coal-based oxy-fuel and postcombustion CO2 capture - case study for Polish conditions. Proceedings of 25th Annual International Pittsburgh Coal Conference; 2008 Sep 29 - Oct 2; Pittsburgh, PA, USA. 132
- Page 1:
Proceedings e report 90
- Page 4 and 5:
ECOS 2012 : the 25 th International
- Page 7 and 8:
Advisory Committee (Track Organizer
- Page 10 and 11:
The 25 th ECOS Conference 1987-2012
- Page 12 and 13:
VOLUME VI CONTENT VI. 1 CARBON CAPT
- Page 14 and 15:
-----------------------------------
- Page 16 and 17:
» Personal transportation energy c
- Page 18 and 19:
» Excess enthalpies of second gene
- Page 20 and 21:
VOLUME IV IV . 1 - FLUID DYNAMICS A
- Page 22 and 23:
» Exergy analysis and genetic algo
- Page 24 and 25:
» Optimal lighting control strateg
- Page 26 and 27:
» Stability and limit cycles in an
- Page 28 and 29:
PROCEEDINGS OF ECOS 2012 - THE 25 T
- Page 30 and 31:
Fig. 2. The exergy destruction of M
- Page 32 and 33:
ineffectiveness of the catalyst, in
- Page 34 and 35:
[ P EXmth EX SNG] ESR F where EXm
- Page 36 and 37:
Fuel inputkW 728221 203771 237719 3
- Page 38 and 39:
Not only at desined Rc (the ratio o
- Page 40 and 41:
4. DISCUSSION The graphic exergy an
- Page 42 and 43:
Figure 9(a) illustrates the energy
- Page 44 and 45:
Engineering Technical Conferences &
- Page 46 and 47:
generally there are four kinds of m
- Page 48 and 49:
However, even under the off-design
- Page 50 and 51:
Fig. 3. 600MW supercritical coal-fi
- Page 52 and 53:
CO2 rich loading(molCO2/molMEA) 0.4
- Page 54 and 55:
Net efficiency (%) 40.28 30.29 26.4
- Page 56 and 57:
Fig. 11. Schematic diagram of heat
- Page 58 and 59:
28.67%. In addition, through heat i
- Page 60 and 61:
Applied Thermal Engineering 2010;30
- Page 62 and 63:
Abstract: PROCEEDINGS OF ECOS 2012
- Page 64 and 65:
Fig. 1. Solution diagram of „four
- Page 66 and 67:
K ~ K 1 eK 1a p K 1a iK mK
- Page 68 and 69:
Oxygen recovery rate, % 105 95 85 7
- Page 70 and 71:
Calculated optimal compressor press
- Page 72 and 73:
PROCEEDINGS OF ECOS 2012 - THE 25 T
- Page 74 and 75:
The net amount of the flue gas leav
- Page 76 and 77:
Figure 3. Idea for lignite drying b
- Page 78 and 79:
Energy efficiency, % 34,00 33,00 32
- Page 80 and 81:
points efficiency increase related
- Page 82 and 83:
Figure A1b. Thermoflex flow sheet o
- Page 84 and 85:
Figure A3a. Thermoflex flow sheet o
- Page 86 and 87:
Figure A4. Thermoflex flow sheet of
- Page 88 and 89:
Abstract: PROCEEDINGS OF ECOS 2012
- Page 90 and 91:
2.1. Life Cycle Assessment 2.1.1. G
- Page 92 and 93:
these factors. A sensitivity analys
- Page 94 and 95:
methane slip contributes to 13% of
- Page 96 and 97:
As can be seen in Fig. 5 the impact
- Page 98 and 99:
References [1] Eurobserv’er, The
- Page 100 and 101:
PROCEEDINGS OF ECOS 2012 - THE 25 T
- Page 102 and 103:
in which CO2 is separated from H2,
- Page 104 and 105:
dimensions of water droplets and wa
- Page 106 and 107:
Temperature (°C) 8 7 6 5 4 3 2 1 0
- Page 108 and 109: 4. Conclusions In the present paper
- Page 110 and 111: Abstract: PROCEEDINGS OF ECOS 2012
- Page 112 and 113: penalty, but without separate captu
- Page 114 and 115: 0.5 - 0.7 kg/kg, resulting typicall
- Page 116 and 117: 3.3 - Utilising waste heat All exis
- Page 118 and 119: 4.5 - Suomusjärvi olivine deposits
- Page 120 and 121: material will change from a few % t
- Page 122 and 123: Fig. 5 Schematic diagram of the PFB
- Page 124 and 125: 8. Combined SO2 capture and CO2 min
- Page 126 and 127: Fig. 10 Carbonate- (left) and sulph
- Page 128 and 129: [13] Ekdahl, E., Idman, H. Statemen
- Page 130 and 131: Abstract: PROCEEDINGS OF ECOS 2012
- Page 132 and 133: HEAT Fig. 1. Scheme and main reacti
- Page 134: (raw) materials pre-heating and AS
- Page 137 and 138: Fig 3- Aspen Plus® model 110
- Page 139 and 140: Table 4. Elemental and XRD analysis
- Page 141 and 142: the ÅA CSM route. The content of M
- Page 143 and 144: Abstract: PROCEEDINGS OF ECOS 2012
- Page 145 and 146: moisture - 0,2237 ash - 0,0876 LHV
- Page 147 and 148: 2.2 CFB plant For the current momen
- Page 149 and 150: The CO2 emission factor which indic
- Page 151 and 152: The CO2 emission factor calculated
- Page 153 and 154: Appendix A Fig A.1. Simulation mode
- Page 155 and 156: (b) Fig. A.2. Simulation model of C
- Page 157: Table A.1. Calculated parameters at
- Page 161 and 162: with a CC installation could be avo
- Page 163 and 164: 2.3. Basic CHP plant indices. The b
- Page 165 and 166: 3. Off-design calculations The main
- Page 167 and 168: Fig. 6. CHP plant efficiency Fig. 7
- Page 169 and 170: amount of steam delivered to the he
- Page 171 and 172: [5] Lukowicz H., Mroncz M.: Analysi
- Page 173 and 174: water removal is feasible by coolin
- Page 175 and 176: Figure 2. Sketch of the suggested P
- Page 177 and 178: a b Figure 5. a) Exergy balance of
- Page 179 and 180: The basis of comparison of each met
- Page 181 and 182: Figure 7a. Impact of S/CATR on PCU
- Page 183 and 184: However, more energy duty is requir
- Page 185 and 186: Abstract: PROCEEDINGS OF ECOS 2012
- Page 187 and 188: 3.1. JACOBIAN-ASPEN Interface ASPEN
- Page 189 and 190: Fig. 3. Triple Pressure Bottoming S
- Page 191 and 192: As seen from Table 1, the mass flow
- Page 193 and 194: 4. Conclusion Fig. 5. Partial Emiss
- Page 195 and 196: [19] Yantovski E., Shokotov M., Sho
- Page 197 and 198: investigation and the developing of
- Page 199 and 200: University of L’Aquila and German
- Page 201 and 202: hydrogen combustion technology at d
- Page 203 and 204: eversibility of a pre-treated synth
- Page 205 and 206: Fig. 1. TG curves collected for spe
- Page 207 and 208: (see Fig 5). Carbon dioxide uptake
- Page 209 and 210:
period is reduced to the first 15 c
- Page 211 and 212:
CO2 capture capacity up to 150 th c
- Page 213 and 214:
the way for biogas utilisation is t
- Page 215 and 216:
projectand is described in the foll
- Page 217 and 218:
4. Pilot plant tests In order to de
- Page 219 and 220:
Concerning the absorption reaction,
- Page 221 and 222:
with Regeneration (AwR), consists i
- Page 223 and 224:
[25] Aspen Plus 2004.1. Cambridge,
- Page 225 and 226:
systems for fuel drying waste strea
- Page 227 and 228:
heated in a heat exchanger placed i
- Page 229 and 230:
Fig. 2. Lower heating value of fuel
- Page 231 and 232:
Acknowledgements The results presen
- Page 233 and 234:
large amount of CO2 [1,5-7]. APCr a
- Page 235 and 236:
N 1 i ( x x i n 1 m ) 2.3. Carbon
- Page 237 and 238:
DTA analysis of the untreated APCrs
- Page 239 and 240:
Table 4. Relative Error (%) of the
- Page 241 and 242:
CaO HCl CaCl H O 193kJ / mol (
- Page 243 and 244:
[1] M. Fernández Bertos, S.J.R. Si
- Page 245 and 246:
Abstract: PROCEEDINGS OF ECOS 2012
- Page 247 and 248:
2. Process development 2.1. Backgro
- Page 249 and 250:
to dissolve the chloride salts prec
- Page 251 and 252:
The remaining 25% (5 ml/min) of the
- Page 253 and 254:
Table 6. Experimental conversions o
- Page 255 and 256:
p p 1 1. 5 p H 1 1. 5 2O p mi
- Page 257 and 258:
Calculating from the Aspen Plus mod
- Page 259 and 260:
[11] Mattila, H.-P., Experimental s
- Page 261 and 262:
Mg2SiO4(s) + 2CO2(g) →2MgCO3(s) +
- Page 263 and 264:
(Mg/Fe) of the mineral rock, Mg-sil
- Page 265 and 266:
Figure 2. Effect of Mg/Fe ratio of
- Page 267 and 268:
Figure 4 shows that an increase in
- Page 269 and 270:
Figure 5. Process flow diagram of M
- Page 271 and 272:
2. Only cold utility is needed belo
- Page 273 and 274:
extraction process at 400 °C (~ 62
- Page 275 and 276:
Table A2. Extraction equations and
- Page 277 and 278:
[13] Teir S, Kuusik R, Fogelholm CJ
- Page 279 and 280:
In the area of coal technologies al
- Page 281 and 282:
Tabel 1. Characteristics quantities
- Page 283 and 284:
N m eT 4a ~ T cp T4a 1 ( K
- Page 285 and 286:
Auxiliary power rate of ASU, % 40 4
- Page 287 and 288:
[8] Buhre B.J.P., Elliott L.K., She
- Page 289 and 290:
1.1 - Cement Manufacturing The ceme
- Page 291 and 292:
2. Numerical model The purpose of t
- Page 293 and 294:
-0.309x15.77x2 2.085x3 240x4 12.53x
- Page 295 and 296:
Table 4 - Results of the optimizati
- Page 297 and 298:
PROCEEDINGS OF ECOS 2012 - THE 25 T
- Page 299 and 300:
1. Define the studied system (in th
- Page 301 and 302:
cycle) or a lignin extraction plant
- Page 303 and 304:
limiting factor for the maximum siz
- Page 305 and 306:
Table 5. Key data for the four ener
- Page 307 and 308:
Global CO 2 emissions [ktonnes/yr]
- Page 309 and 310:
for biofuels and the investment cos
- Page 311 and 312:
The possibility to capture CO2 from
- Page 313 and 314:
[17] Berglin N, Andersson L. Proces
- Page 315 and 316:
Therefore NL Agency (an agency of t
- Page 317 and 318:
2.2.2. Pinch analysis Pinch analysi
- Page 319 and 320:
3. Case study 3.1. Plant and proces
- Page 321 and 322:
Te 1000 mp era 900 tur 800 e [°C 7
- Page 323 and 324:
Application of the approach led to
- Page 325 and 326:
The advantage of dynamic models is
- Page 327 and 328:
e equal at both time intervals and
- Page 329 and 330:
2.5. Selecting the number of TSs Se
- Page 331 and 332:
A) Time Slices for solar thermal en
- Page 333 and 334:
The first step of procedure is to p
- Page 335 and 336:
cTSs demand TS solar TSs 0 2 4 6 8
- Page 337 and 338:
In the presented paper a framework
- Page 339 and 340:
[5] Erdil E, Ilkan M, Egelioglu F.
- Page 341 and 342:
PROCEEDINGS OF ECOS 2012 - THE 25 T
- Page 343 and 344:
district energy network simulation
- Page 345 and 346:
were decreased by 10°C.All scenari
- Page 347 and 348:
Site 3 Heat sources Heat load Site
- Page 349 and 350:
3.2.2. Input data and assumptions A
- Page 351 and 352:
Fig.7 shows the operation forecast
- Page 353 and 354:
[13] TERMIS Operation User Guide, 7
- Page 355 and 356:
Polygeneration is a term used to de
- Page 357 and 358:
The increase in energy utilization
- Page 359 and 360:
are available for an entire year, 8
- Page 361 and 362:
6. Extensions to core methodology 6
- Page 363 and 364:
thermal storage and possible suppor
- Page 365 and 366:
laterites. Ore Geology Reviews, v.
- Page 367 and 368:
Abstract: PROCEEDINGS OF ECOS 2012
- Page 369 and 370:
gasification [15], hybrid biomass g
- Page 371 and 372:
the second reactor. In this unit, s
- Page 373 and 374:
The variables effect was evaluated
- Page 375 and 376:
atio, as well as the shift-syngas f
- Page 377 and 378:
Fig. 4. Effect of operating tempera
- Page 379 and 380:
SDG has slight effect on the syngas
- Page 381:
[26.] Castle WF. Air separation and