Design Challenges: Avoiding the Pitfalls, winning the game - Xilinx
Design Challenges: Avoiding the Pitfalls, winning the game - Xilinx
Design Challenges: Avoiding the Pitfalls, winning the game - Xilinx

Create successful ePaper yourself
Turn your PDF publications into a flip-book with our unique Google optimized e-Paper software.
SYSTEM PERFORMANCE<br />
PLB<br />
PowerPC<br />
APU<br />
I/F<br />
APU<br />
Control<br />
Hard Processor Block<br />
Soft<br />
Auxiliary<br />
FPGA Processor<br />
Interface<br />
OCM FPGA Fabric<br />
Figure 2 – Virtex-4 FX APU<br />
“co-processing” and use <strong>the</strong> intelligent tools<br />
to build a direct connect from <strong>the</strong> embedded<br />
PowerPC cores to high-performance<br />
FPGA fabric, where hardware accelerator<br />
functions can operate as extensions to <strong>the</strong><br />
PowerPC. As shown in Figure 2, you can<br />
improve <strong>the</strong> overall system performance by<br />
offloading computationally demanding<br />
applications from <strong>the</strong> main CPU.<br />
By its very nature, FPGA hardware fabric<br />
is parallel in structure and can be used<br />
to accelerate system functions orders of<br />
magnitude faster than clocking methods<br />
can provide. In this example, <strong>the</strong> PowerPC<br />
core is complemented by an APU<br />
(Auxiliary Processor Unit), which inter-<br />
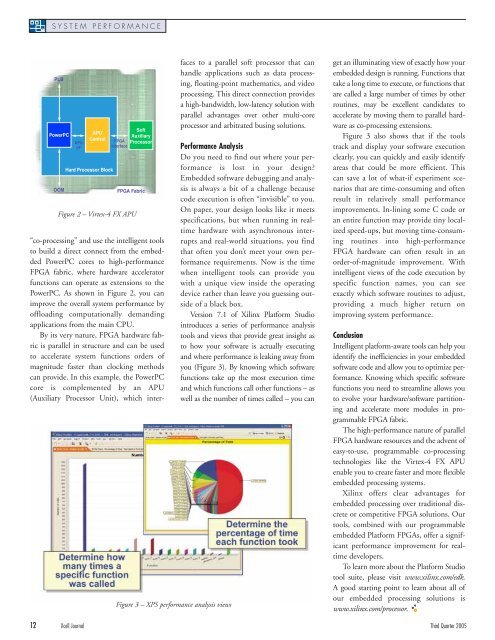
Figure 3 – XPS performance analysis views<br />
faces to a parallel soft processor that can<br />
handle applications such as data processing,<br />
floating-point ma<strong>the</strong>matics, and video<br />
processing. This direct connection provides<br />
a high-bandwidth, low-latency solution with<br />
parallel advantages over o<strong>the</strong>r multi-core<br />
processor and arbitrated busing solutions.<br />
Performance Analysis<br />
Do you need to find out where your performance<br />
is lost in your design?<br />
Embedded software debugging and analysis<br />
is always a bit of a challenge because<br />
code execution is often “invisible” to you.<br />
On paper, your design looks like it meets<br />
specifications, but when running in realtime<br />
hardware with asynchronous interrupts<br />
and real-world situations, you find<br />
that often you don’t meet your own performance<br />
requirements. Now is <strong>the</strong> time<br />
when intelligent tools can provide you<br />
with a unique view inside <strong>the</strong> operating<br />
device ra<strong>the</strong>r than leave you guessing outside<br />
of a black box.<br />
Version 7.1 of <strong>Xilinx</strong> Platform Studio<br />
introduces a series of performance analysis<br />
tools and views that provide great insight as<br />
to how your software is actually executing<br />
and where performance is leaking away from<br />
you (Figure 3). By knowing which software<br />
functions take up <strong>the</strong> most execution time<br />
and which functions call o<strong>the</strong>r functions – as<br />
well as <strong>the</strong> number of times called – you can<br />
get an illuminating view of exactly how your<br />
embedded design is running. Functions that<br />
take a long time to execute, or functions that<br />
are called a large number of times by o<strong>the</strong>r<br />
routines, may be excellent candidates to<br />
accelerate by moving <strong>the</strong>m to parallel hardware<br />
as co-processing extensions.<br />
Figure 3 also shows that if <strong>the</strong> tools<br />
track and display your software execution<br />
clearly, you can quickly and easily identify<br />
areas that could be more efficient. This<br />
can save a lot of what-if experiment scenarios<br />
that are time-consuming and often<br />
result in relatively small performance<br />
improvements. In-lining some C code or<br />
an entire function may provide tiny localized<br />
speed-ups, but moving time-consuming<br />
routines into high-performance<br />
FPGA hardware can often result in an<br />
order-of-magnitude improvement. With<br />
intelligent views of <strong>the</strong> code execution by<br />
specific function names, you can see<br />
exactly which software routines to adjust,<br />
providing a much higher return on<br />
improving system performance.<br />
Conclusion<br />
Intelligent platform-aware tools can help you<br />
identify <strong>the</strong> inefficiencies in your embedded<br />
software code and allow you to optimize performance.<br />
Knowing which specific software<br />
functions you need to streamline allows you<br />
to evolve your hardware/software partitioning<br />
and accelerate more modules in programmable<br />
FPGA fabric.<br />
The high-performance nature of parallel<br />
FPGA hardware resources and <strong>the</strong> advent of<br />
easy-to-use, programmable co-processing<br />
technologies like <strong>the</strong> Virtex-4 FX APU<br />
enable you to create faster and more flexible<br />
embedded processing systems.<br />
<strong>Xilinx</strong> offers clear advantages for<br />
embedded processing over traditional discrete<br />
or competitive FPGA solutions. Our<br />
tools, combined with our programmable<br />
embedded Platform FPGAs, offer a significant<br />
performance improvement for realtime<br />
developers.<br />
To learn more about <strong>the</strong> Platform Studio<br />
tool suite, please visit www.xilinx.com/edk.<br />
A good starting point to learn about all of<br />
our embedded processing solutions is<br />
www.xilinx.com/processor.<br />
12 Xcell Journal Third Quarter 2005