Texte intégral / Full text (pdf, 20 MiB) - Infoscience - EPFL
Texte intégral / Full text (pdf, 20 MiB) - Infoscience - EPFL
Texte intégral / Full text (pdf, 20 MiB) - Infoscience - EPFL

Create successful ePaper yourself
Turn your PDF publications into a flip-book with our unique Google optimized e-Paper software.
Chapter 7. Experimental Validation - Agoraphobia<br />
10<br />
9<br />
8<br />
7<br />
6<br />
5<br />
4<br />
3<br />
2<br />
1<br />
0<br />
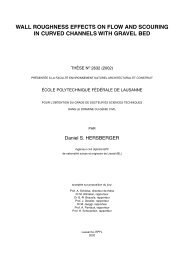
Are the characters aware of you?<br />
User−centered Interest−centered User or Interest Random<br />
Figure 7.10: Graphical results to the assessment of character awareness towards the user.<br />
compared modes except for the user-centered versus the user or interest-centered modes.<br />
The perceived difference in friendliness also falls into this category for the user-centered<br />
versus random modes and the user or interest-centered versus random modes. Finally, it is<br />
also the case in the assessment of character awareness towards the user for all modes except<br />
user-centered versus user or interest-centered modes and interest-centered versus user or<br />
interest-centered modes. Even though we did not obtain statistically significant differences<br />
in observation for the other questions, we have to take into consideration that these measures<br />
remain subjective and that variability may thus be highly increased as compared to objective<br />
measurements. Moreover, these results are in line with those we have been able to observe<br />
in graphs 7.3 to 7.10.<br />
We have also tested the correlation between various questions. To this end, we have used<br />
Pearson’s product-moment correlation coefficient r:<br />
r = 1<br />
n − 1<br />
n<br />
<br />
Xi − ¯ <br />
X Yi − ¯ <br />
Y<br />
i=1<br />
sX<br />
sY<br />
(7.1)<br />
The convention is to use r 2 as measure of association between two variables. For instance,<br />
the value of r 2 between the results to the second and eighth questions is of 0.73. 73%<br />
of the variance in the perceived gaze of characters can be accounted for by changes in the<br />
perceived awareness of the characters towards the user. Thus, these two values are correlated<br />
at 73% in average. The correlation between the second and third questions is of 0.53. 53%<br />
of the variance in immersion can thus be accounted for by changes in quantity of perceived<br />
gaze. We have also tested the correlation between immersion and perceived awareness of<br />
the characters towards the users. This value is of 59%. Similarly, the correlation between<br />
perceived friendliness and perceived awareness of characters towards the user is of 53%.<br />
114