Texte intégral / Full text (pdf, 20 MiB) - Infoscience - EPFL
Texte intégral / Full text (pdf, 20 MiB) - Infoscience - EPFL
Texte intégral / Full text (pdf, 20 MiB) - Infoscience - EPFL

You also want an ePaper? Increase the reach of your titles
YUMPU automatically turns print PDFs into web optimized ePapers that Google loves.
6.4. Eye-tracking for Interaction<br />
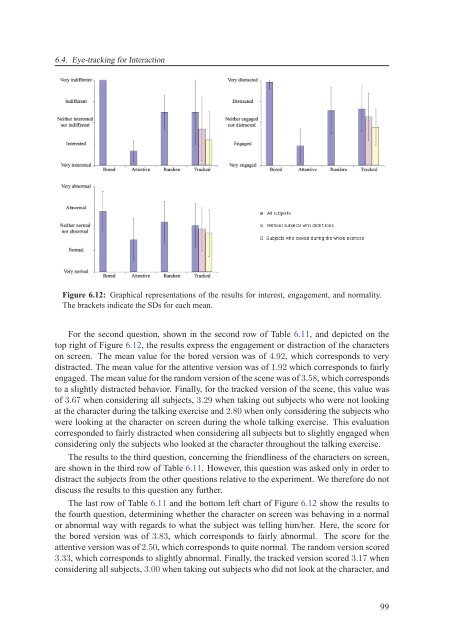
Figure 6.12: Graphical representations of the results for interest, engagement, and normality.<br />
The brackets indicate the SDs for each mean.<br />
For the second question, shown in the second row of Table 6.11, and depicted on the<br />
top right of Figure 6.12, the results express the engagement or distraction of the characters<br />
on screen. The mean value for the bored version was of 4.92, which corresponds to very<br />
distracted. The mean value for the attentive version was of 1.92 which corresponds to fairly<br />
engaged. The mean value for the random version of the scene was of 3.58, which corresponds<br />
to a slightly distracted behavior. Finally, for the tracked version of the scene, this value was<br />
of 3.67 when considering all subjects, 3.29 when taking out subjects who were not looking<br />
at the character during the talking exercise and 2.80 when only considering the subjects who<br />
were looking at the character on screen during the whole talking exercise. This evaluation<br />
corresponded to fairly distracted when considering all subjects but to slightly engaged when<br />
considering only the subjects who looked at the character throughout the talking exercise.<br />
The results to the third question, concerning the friendliness of the characters on screen,<br />
are shown in the third row of Table 6.11. However, this question was asked only in order to<br />
distract the subjects from the other questions relative to the experiment. We therefore do not<br />
discuss the results to this question any further.<br />
The last row of Table 6.11 and the bottom left chart of Figure 6.12 show the results to<br />
the fourth question, determining whether the character on screen was behaving in a normal<br />
or abnormal way with regards to what the subject was telling him/her. Here, the score for<br />
the bored version was of 3.83, which corresponds to fairly abnormal. The score for the<br />
attentive version was of 2.50, which corresponds to quite normal. The random version scored<br />
3.33, which corresponds to slightly abnormal. Finally, the tracked version scored 3.17 when<br />
considering all subjects, 3.00 when taking out subjects who did not look at the character, and<br />
99