Feeding Systems with Legumes to Intensify Dairy Farms - cgiar
Feeding Systems with Legumes to Intensify Dairy Farms - cgiar
Feeding Systems with Legumes to Intensify Dairy Farms - cgiar

Create successful ePaper yourself
Turn your PDF publications into a flip-book with our unique Google optimized e-Paper software.
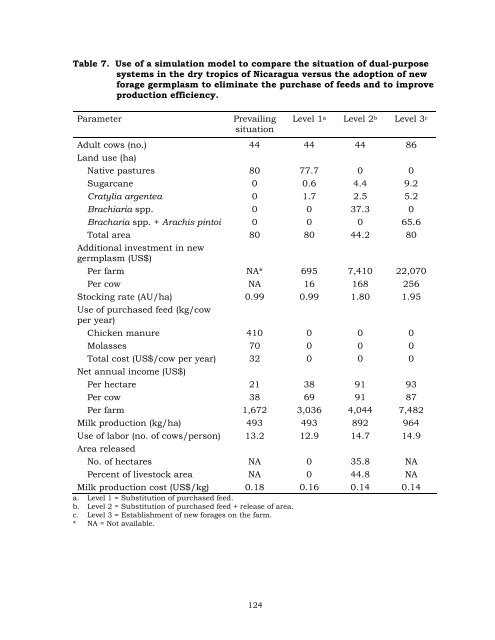
Table 7. Use of a simulation model <strong>to</strong> compare the situation of dual-purpose<br />
systems in the dry tropics of Nicaragua versus the adoption of new<br />
forage germplasm <strong>to</strong> eliminate the purchase of feeds and <strong>to</strong> improve<br />
production efficiency.<br />
Parameter Prevailing<br />
situation<br />
124<br />
Level 1 a<br />
Level 2 b Level 3 c<br />
Adult cows (no.) 44 44 44 86<br />
Land use (ha)<br />
Native pastures 80 77.7 0 0<br />
Sugarcane 0 0.6 4.4 9.2<br />
Cratylia argentea 0 1.7 2.5 5.2<br />
Brachiaria spp. 0 0 37.3 0<br />
Bracharia spp. + Arachis pin<strong>to</strong>i 0 0 0 65.6<br />
Total area<br />
Additional investment in new<br />
germplasm (US$)<br />
80 80 44.2 80<br />
Per farm NA* 695 7,410 22,070<br />
Per cow NA 16 168 256<br />
S<strong>to</strong>cking rate (AU/ha)<br />
Use of purchased feed (kg/cow<br />
per year)<br />
0.99 0.99 1.80 1.95<br />
Chicken manure 410 0 0 0<br />
Molasses 70 0 0 0<br />
Total cost (US$/cow per year)<br />
Net annual income (US$)<br />
32 0 0 0<br />
Per hectare 21 38 91 93<br />
Per cow 38 69 91 87<br />
Per farm 1,672 3,036 4,044 7,482<br />
Milk production (kg/ha) 493 493 892 964<br />
Use of labor (no. of cows/person)<br />
Area released<br />
13.2 12.9 14.7 14.9<br />
No. of hectares NA 0 35.8 NA<br />
Percent of lives<strong>to</strong>ck area NA 0 44.8 NA<br />
Milk production cost (US$/kg) 0.18 0.16 0.14 0.14<br />
a. Level 1 = Substitution of purchased feed.<br />
b. Level 2 = Substitution of purchased feed + release of area.<br />
c. Level 3 = Establishment of new forages on the farm.<br />
* NA = Not available.