Dave Forsey Chief Executive 19 July 2012 - Sports Direct International
Dave Forsey Chief Executive 19 July 2012 - Sports Direct International
Dave Forsey Chief Executive 19 July 2012 - Sports Direct International

You also want an ePaper? Increase the reach of your titles
YUMPU automatically turns print PDFs into web optimized ePapers that Google loves.
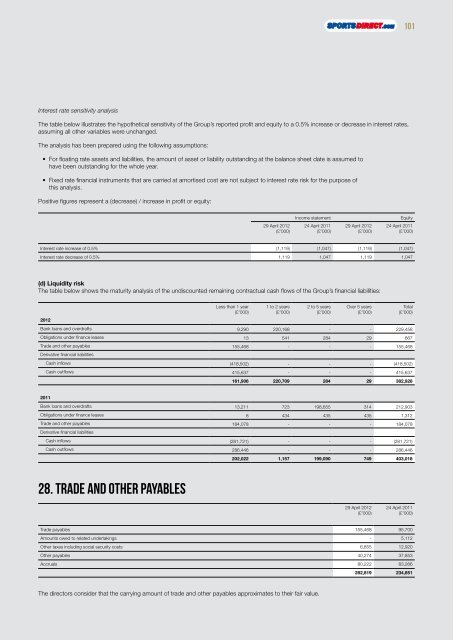
Interest rate sensitivity analysis<br />
The table below illustrates the hypothetical sensitivity of the Group’s reported profit and equity to a 0.5% increase or decrease in interest rates,<br />
assuming all other variables were unchanged.<br />
The analysis has been prepared using the following assumptions:<br />
• For floating rate assets and liabilities, the amount of asset or liability outstanding at the balance sheet date is assumed to<br />
have been outstanding for the whole year.<br />
• Fixed rate financial instruments that are carried at amortised cost are not subject to interest rate risk for the purpose of<br />
this analysis.<br />
Positive figures represent a (decrease) / increase in profit or equity:<br />
29 April <strong>2012</strong><br />
(£’000)<br />
Income statement Equity<br />
24 April 2011<br />
(£’000)<br />
29 April <strong>2012</strong><br />
(£’000)<br />
24 April 2011<br />
(£’000)<br />
Interest rate increase of 0.5% (1,1<strong>19</strong>) (1,047) (1,1<strong>19</strong>) (1,047)<br />
Interest rate decrease of 0.5% 1,1<strong>19</strong> 1,047 1,1<strong>19</strong> 1,047<br />
(d) Liquidity risk<br />
The table below shows the maturity analysis of the undiscounted remaining contractual cash flows of the Group’s financial liabilities:<br />
Less than 1 year<br />
(£’000)<br />
1 to 2 years<br />
(£’000)<br />
2 to 5 years<br />
(£’000)<br />
Over 5 years<br />
(£’000)<br />
<strong>2012</strong><br />
Bank loans and overdrafts 9,290 220,168 - - 229,458<br />
Obligations under finance leases 13 541 284 29 867<br />
Trade and other payables<br />
Derivative financial liabilities<br />
155,468 - - - 155,468<br />
Cash inflows (418,502) - - - (418,502)<br />
Cash outflows 415,637 - - - 415,637<br />
161,906 220,709 284 29 382,928<br />
2011<br />
Bank loans and overdrafts 13,211 723 <strong>19</strong>8,655 314 212,903<br />
Obligations under finance leases 8 434 435 435 1,312<br />
Trade and other payables<br />
Derivative financial liabilities<br />
184,078 - - - 184,078<br />
Cash inflows (281,721) - - - (281,721)<br />
Cash outflows 286,446 - - - 286,446<br />
202,022 1,157 <strong>19</strong>9,090 749 403,018<br />
28. Trade and other payables<br />
29 April <strong>2012</strong><br />
(£’000)<br />
Total<br />
(£’000)<br />
24 April 2011<br />
(£’000)<br />
Trade payables 155,468 95,700<br />
Amounts owed to related undertakings - 5,112<br />
Other taxes including social security costs 6,855 12,920<br />
Other payables 40,274 37,853<br />
Accruals 80,222 83,266<br />
282,8<strong>19</strong> 234,851<br />
The directors consider that the carrying amount of trade and other payables approximates to their fair value.<br />
101
![Our ref: [ ] - Sports Direct International](https://img.yumpu.com/19248141/1/184x260/our-ref-sports-direct-international.jpg?quality=85)


![Our ref: [ ] - Sports Direct International](https://img.yumpu.com/18440214/1/184x260/our-ref-sports-direct-international.jpg?quality=85)