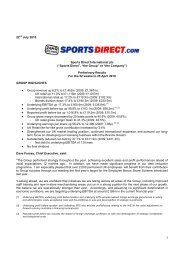
Dave Forsey Chief Executive 19 July 2012 - Sports Direct International
Dave Forsey Chief Executive 19 July 2012 - Sports Direct International
Dave Forsey Chief Executive 19 July 2012 - Sports Direct International

Create successful ePaper yourself
Turn your PDF publications into a flip-book with our unique Google optimized e-Paper software.
80 / FINANCIAL STATEMENTS AND NOTES<br />
notes to the Financial Statements<br />
For the 53 weeks ended 29 April <strong>2012</strong><br />
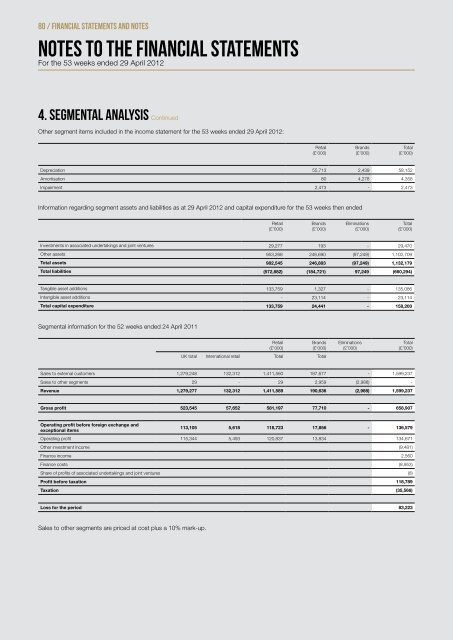
4. Segmental analysis Continued<br />
Other segment items included in the income statement for the 53 weeks ended 29 April <strong>2012</strong>:<br />
Depreciation 55,713 2,439 58,152<br />
Amortisation 80 4,278 4,358<br />
Impairment 2,473 - 2,473<br />
Retail<br />
(£’000)<br />
Information regarding segment assets and liabilities as at 29 April <strong>2012</strong> and capital expenditure for the 53 weeks then ended<br />
Retail<br />
(£’000)<br />
Brands<br />
(£’000)<br />
Brands<br />
(£’000)<br />
Eliminations<br />
(£’000)<br />
Investments in associated undertakings and joint ventures 29,277 <strong>19</strong>3 - 29,470<br />
Other assets 953,268 246,690 (97,249) 1,102,709<br />
Total assets 982,545 246,883 (97,249) 1,132,179<br />
Total liabilities (572,882) (184,721) 97,249 (660,294)<br />
Tangible asset additions 133,759 1,327 - 135,086<br />
Intangible asset additions - 23,114 - 23,114<br />
Total capital expenditure 133,759 24,441 - 158,200<br />
Segmental information for the 52 weeks ended 24 April 2011<br />
Retail<br />
(£’000)<br />
Brands<br />
(£’000)<br />
UK total <strong>International</strong> retail Total Total<br />
Eliminations<br />
(£’000)<br />
Sales to external customers 1,279,248 132,312 1,411,560 187,677 - 1,599,237<br />
Sales to other segments 29 - 29 2,959 (2,988) -<br />
Revenue 1,279,277 132,312 1,411,589 <strong>19</strong>0,636 (2,988) 1,599,237<br />
Gross profit 523,545 57,652 581,<strong>19</strong>7 77,710 - 658,907<br />
Operating profit before foreign exchange and<br />
exceptional items<br />
113,105 5,618 118,723 17,856 - 136,579<br />
Operating profit 115,344 5,493 120,837 13,834 134,671<br />
Other investment income (9,481)<br />
Finance income 2,560<br />
Finance costs (8,953)<br />
Share of profits of associated undertakings and joint ventures (8)<br />
Profit before taxation 118,789<br />
Taxation (35,566)<br />
Loss for the period 83,223<br />
Sales to other segments are priced at cost plus a 10% mark-up.<br />
Total<br />
(£’000)<br />
Total<br />
(£’000)<br />
Total<br />
(£’000)
![Our ref: [ ] - Sports Direct International](https://img.yumpu.com/19248141/1/184x260/our-ref-sports-direct-international.jpg?quality=85)

![Our ref: [ ] - Sports Direct International](https://img.yumpu.com/18440214/1/184x260/our-ref-sports-direct-international.jpg?quality=85)