Dave Forsey Chief Executive 19 July 2012 - Sports Direct International
Dave Forsey Chief Executive 19 July 2012 - Sports Direct International
Dave Forsey Chief Executive 19 July 2012 - Sports Direct International

You also want an ePaper? Increase the reach of your titles
YUMPU automatically turns print PDFs into web optimized ePapers that Google loves.
At each balance sheet date, there were no significant<br />
concentrations of credit risk. The maximum exposure to credit risk<br />
is represented by the carrying amount of each financial asset in the<br />
balance sheet.<br />
Investments of cash surpluses, borrowings and derivative<br />
instruments are made through banks and companies which must<br />
fulfil credit rating and investment criteria approved by the Board.<br />
4. Segmental analysis<br />
Liquidity risk<br />
The availability of adequate cash resources is managed by the<br />
Group through utilisation of its revolving bank and other facilities<br />
together with equity and retained profits thereby achieving<br />
continuity of funding and short-term flexibility.<br />
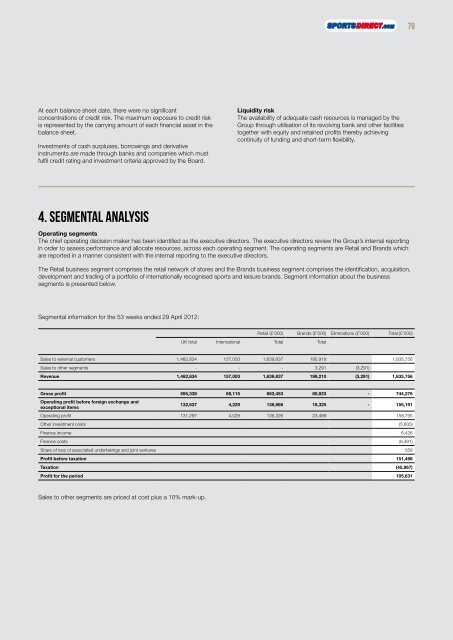
Operating segments<br />
The chief operating decision maker has been identified as the executive directors. The executive directors review the Group’s internal reporting<br />
in order to assess performance and allocate resources, across each operating segment. The operating segments are Retail and Brands which<br />
are reported in a manner consistent with the internal reporting to the executive directors.<br />
The Retail business segment comprises the retail network of stores and the Brands business segment comprises the identification, acquisition,<br />
development and trading of a portfolio of internationally recognised sports and leisure brands. Segment information about the business<br />
segments is presented below.<br />
Segmental information for the 53 weeks ended 29 April <strong>2012</strong>:<br />
UK total <strong>International</strong> Total Total<br />
Retail (£’000) Brands (£’000) Eliminations (£’000) Total (£’000)<br />
Sales to external customers 1,482,834 157,003 1,639,837 <strong>19</strong>5,9<strong>19</strong> 1,835,756<br />
Sales to other segments - - - 3,291 (3,291)<br />
Revenue 1,482,834 157,003 1,639,837 <strong>19</strong>9,210 (3,291) 1,835,756<br />
Gross profit 595,338 68,115 663,453 80,823 - 744,276<br />
Operating profit before foreign exchange and<br />
exceptional items<br />
132,637 4,229 136,866 18,325 - 155,<strong>19</strong>1<br />
Operating profit 131,297 4,029 135,326 23,469 158,795<br />
Other investment costs (5,800)<br />
Finance income 6,426<br />
Finance costs (8,481)<br />
Share of loss of associated undertakings and joint ventures 558<br />
Profit before taxation 151,498<br />
Taxation (45,867)<br />
Profit for the period 105,631<br />
Sales to other segments are priced at cost plus a 10% mark-up.<br />
79
![Our ref: [ ] - Sports Direct International](https://img.yumpu.com/19248141/1/184x260/our-ref-sports-direct-international.jpg?quality=85)


![Our ref: [ ] - Sports Direct International](https://img.yumpu.com/18440214/1/184x260/our-ref-sports-direct-international.jpg?quality=85)