Dave Forsey Chief Executive 19 July 2012 - Sports Direct International
Dave Forsey Chief Executive 19 July 2012 - Sports Direct International
Dave Forsey Chief Executive 19 July 2012 - Sports Direct International

You also want an ePaper? Increase the reach of your titles
YUMPU automatically turns print PDFs into web optimized ePapers that Google loves.
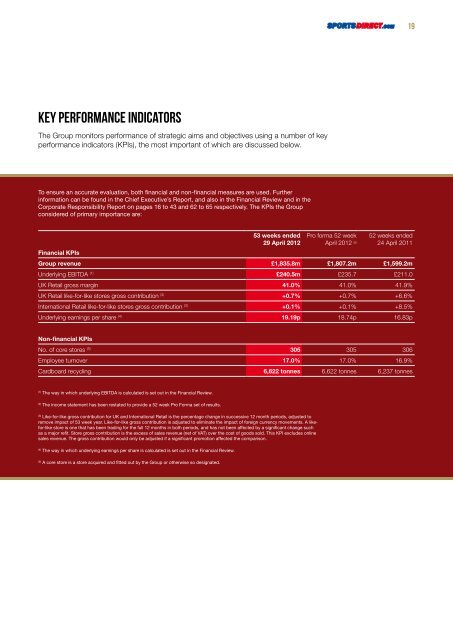
Key performance Indicators<br />
The Group monitors performance of strategic aims and objectives using a number of key<br />
performance indicators (KPIs), the most important of which are discussed below.<br />
To ensure an accurate evaluation, both financial and non-financial measures are used. Further<br />
information can be found in the <strong>Chief</strong> <strong>Executive</strong>’s Report, and also in the Financial Review and in the<br />
Corporate Responsibility Report on pages 16 to 43 and 62 to 65 respectively. The KPIs the Group<br />
considered of primary importance are:<br />
(1) The way in which underlying EBITDA is calculated is set out in the Financial Review.<br />
(2) The income statement has been restated to provide a 52 week Pro Forma set of results.<br />
(3) Like-for-like gross contribution for UK and <strong>International</strong> Retail is the percentage change in successive 12 month periods, adjusted to<br />
remove impact of 53 week year. Like-for-like gross contribution is adjusted to eliminate the impact of foreign currency movements. A likefor-like<br />
store is one that has been trading for the full 12 months in both periods, and has not been affected by a significant change such<br />
as a major refit. Store gross contribution is the excess of sales revenue (net of VAT) over the cost of goods sold. This KPI excludes online<br />
sales revenue. The gross contribution would only be adjusted if a significant promotion affected the comparison.<br />
(4) The way in which underlying earnings per share is calculated is set out in the Financial Review.<br />
(5) A core store is a store acquired and fitted out by the Group or otherwise so designated.<br />
53 weeks ended<br />
29 April <strong>2012</strong><br />
Pro forma 52 week<br />
April <strong>2012</strong> (2)<br />
52 weeks ended<br />
24 April 2011<br />
Financial KPIs<br />
Group revenue £1,835.8m £1,807.2m £1,599.2m<br />
Underlying EBITDA (1) £240.5m £235.7 £211.0<br />
UK Retail gross margin 41.0% 41.0% 41.9%<br />
UK Retail like-for-like stores gross contribution (3) +0.7% +0.7% +6.6%<br />
<strong>International</strong> Retail like-for-like stores gross contribution (3) +0.1% +0.1% +8.5%<br />
Underlying earnings per share (4) <strong>19</strong>.<strong>19</strong>p 18.74p 16.83p<br />
Non-financial KPIs<br />
No. of core stores (5) 305 305 306<br />
Employee turnover 17.0% 17.0% 16.9%<br />
Cardboard recycling 6,622 tonnes 6,622 tonnes 6,237 tonnes<br />
<strong>19</strong>
![Our ref: [ ] - Sports Direct International](https://img.yumpu.com/19248141/1/184x260/our-ref-sports-direct-international.jpg?quality=85)

![Our ref: [ ] - Sports Direct International](https://img.yumpu.com/18440214/1/184x260/our-ref-sports-direct-international.jpg?quality=85)