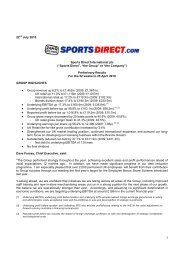
Dave Forsey Chief Executive 19 July 2012 - Sports Direct International
Dave Forsey Chief Executive 19 July 2012 - Sports Direct International
Dave Forsey Chief Executive 19 July 2012 - Sports Direct International

Create successful ePaper yourself
Turn your PDF publications into a flip-book with our unique Google optimized e-Paper software.
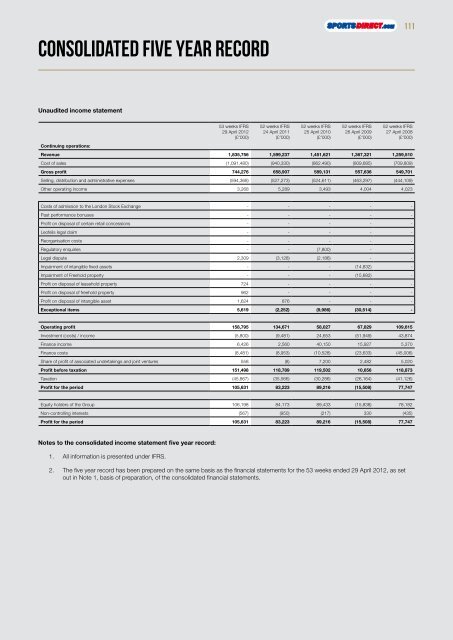
consolidated five year record<br />
Unaudited income statement<br />
Continuing operations:<br />
53 weeks IFRS<br />
29 April <strong>2012</strong><br />
(£’000)<br />
52 weeks IFRS<br />
24 April 2011<br />
(£’000)<br />
52 weeks IFRS<br />
25 April 2010<br />
(£’000)<br />
52 weeks IFRS<br />
26 April 2009<br />
(£’000)<br />
52 weeks IFRS<br />
27 April 2008<br />
(£’000)<br />
Revenue 1,835,756 1,599,237 1,451,621 1,367,321 1,259,510<br />
Cost of sales (1,091,480) (940,330) (862.490) (809,685) (709,809)<br />
Gross profit 744,276 658,907 589,131 557,636 549,701<br />
Selling, distribution and administrative expenses (594,368) (527,273) (524,611) (463,297) (444,109)<br />
Other operating income 3,268 5,289 3,493 4,004 4,023<br />
Costs of admission to the London Stock Exchange - - - - -<br />
Past performance bonuses - - - - -<br />
Profit on disposal of certain retail concessions - - - - -<br />
Leofelis legal claim - - - - -<br />
Reorganisation costs - - - - -<br />
Regulatory enquiries - - (7,800) - -<br />
Legal dispute 2,309 (3,128) (2,186) - -<br />
Impairment of intangible fixed assets - - - (14,832) -<br />
Impairment of Freehold property - - - (15,682) -<br />
Profit on disposal of leasehold property 724 - - - -<br />
Profit on disposal of freehold property 962 - - - -<br />
Profit on disposal of intangible asset 1,624 876 - - -<br />
Exceptional items 5,6<strong>19</strong> (2,252) (9,986) (30,514) -<br />
Operating profit 158,795 134,671 58,027 67,829 109,615<br />
Investment (costs) / income (5,800) (9,481) 24,653 (51,949) 43,874<br />
Finance income 6,426 2,560 40,150 15,927 5,370<br />
Finance costs (8,481) (8,953) (10,528) (23,633) (45,006)<br />
Share of profit of associated undertakings and joint ventures 558 (8) 7,200 2,482 5,020<br />
Profit before taxation 151,498 118,789 1<strong>19</strong>,502 10,656 118,873<br />
Taxation (45,867) (35,566) (30,286) (26,164) (41,126)<br />
Profit for the period 105,631 83,223 89,216 (15,508) 77,747<br />
Equity holders of the Group 106,<strong>19</strong>8 84,173 89,433 (15,838) 78,182<br />
Non-controlling interests (567) (950) (217) 330 (435)<br />
Profit for the period 105,631 83,223 89,216 (15,508) 77,747<br />
Notes to the consolidated income statement five year record:<br />
1. All information is presented under IFRS.<br />
2. The five year record has been prepared on the same basis as the financial statements for the 53 weeks ended 29 April <strong>2012</strong>, as set<br />
out in Note 1, basis of preparation, of the consolidated financial statements.<br />
111
![Our ref: [ ] - Sports Direct International](https://img.yumpu.com/19248141/1/184x260/our-ref-sports-direct-international.jpg?quality=85)

![Our ref: [ ] - Sports Direct International](https://img.yumpu.com/18440214/1/184x260/our-ref-sports-direct-international.jpg?quality=85)