Dave Forsey Chief Executive 19 July 2012 - Sports Direct International
Dave Forsey Chief Executive 19 July 2012 - Sports Direct International
Dave Forsey Chief Executive 19 July 2012 - Sports Direct International

You also want an ePaper? Increase the reach of your titles
YUMPU automatically turns print PDFs into web optimized ePapers that Google loves.
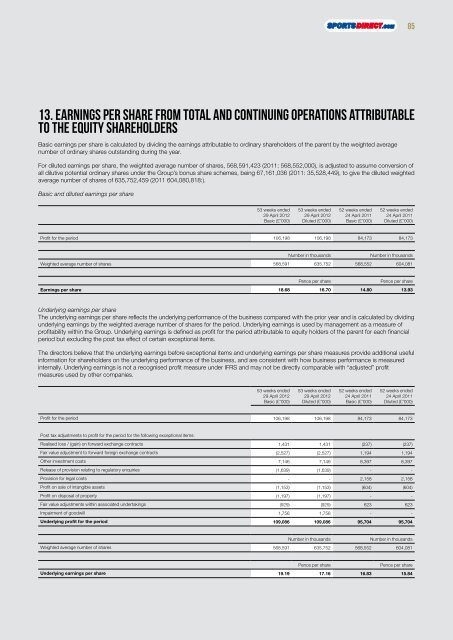
13. Earnings per share from total and continuing operations attributable<br />
to the equity shareholders<br />
Basic earnings per share is calculated by dividing the earnings attributable to ordinary shareholders of the parent by the weighted average<br />
number of ordinary shares outstanding during the year.<br />
For diluted earnings per share, the weighted average number of shares, 568,591,423 (2011: 568,552,000), is adjusted to assume conversion of<br />
all dilutive potential ordinary shares under the Group’s bonus share schemes, being 67,161,036 (2011: 35,528,449), to give the diluted weighted<br />
average number of shares of 635,752,459 (2011 604,080,818:).<br />
Basic and diluted earnings per share<br />
53 weeks ended<br />
29 April <strong>2012</strong><br />
Basic (£’000)<br />
53 weeks ended<br />
29 April <strong>2012</strong><br />
Diluted (£’000)<br />
52 weeks ended<br />
24 April 2011<br />
Basic (£’000)<br />
52 weeks ended<br />
24 April 2011<br />
Diluted (£’000)<br />
Profit for the period 106,<strong>19</strong>8 106,<strong>19</strong>8 84,173 84,173<br />
Number in thousands Number in thousands<br />
Weighted average number of shares 568,591 635,752 568,552 604,081<br />
Pence per share Pence per share<br />
Earnings per share 18.68 16.70 14.80 13.93<br />
Underlying earnings per share<br />
The underlying earnings per share reflects the underlying performance of the business compared with the prior year and is calculated by dividing<br />
underlying earnings by the weighted average number of shares for the period. Underlying earnings is used by management as a measure of<br />
profitability within the Group. Underlying earnings is defined as profit for the period attributable to equity holders of the parent for each financial<br />
period but excluding the post tax effect of certain exceptional items.<br />
The directors believe that the underlying earnings before exceptional items and underlying earnings per share measures provide additional useful<br />
information for shareholders on the underlying performance of the business, and are consistent with how business performance is measured<br />
internally. Underlying earnings is not a recognised profit measure under IFRS and may not be directly comparable with “adjusted” profit<br />
measures used by other companies.<br />
53 weeks ended<br />
29 April <strong>2012</strong><br />
Basic (£’000)<br />
53 weeks ended<br />
29 April <strong>2012</strong><br />
Diluted (£’000)<br />
52 weeks ended<br />
24 April 2011<br />
Basic (£’000)<br />
52 weeks ended<br />
24 April 2011<br />
Diluted (£’000)<br />
Profit for the period 106,<strong>19</strong>8 106,<strong>19</strong>8 84,173 84,173<br />
Post tax adjustments to profit for the period for the following exceptional items:<br />
Realised loss / (gain) on forward exchange contracts 1,431 1,431 (237) (237)<br />
Fair value adjustment to forward foreign exchange contracts (2,527) (2,527) 1,<strong>19</strong>4 1,<strong>19</strong>4<br />
Other investment costs 7,146 7,146 8,397 8,397<br />
Release of provision relating to regulatory enquiries (1,639) (1,639) - -<br />
Provision for legal costs - - 2,158 2,158<br />
Profit on sale of intangible assets (1,153) (1,153) (604) (604)<br />
Profit on disposal of property (1,<strong>19</strong>7) (1,<strong>19</strong>7) - -<br />
Fair value adjustments within associated undertakings (929) (929) 623 623<br />
Impairment of goodwill 1,756 1,756 - -<br />
Underlying profit for the period 109,086 109,086 95,704 95,704<br />
Number in thousands Number in thousands<br />
Weighted average number of shares 568,591 635,752 568,552 604,081<br />
Pence per share Pence per share<br />
Underlying earnings per share <strong>19</strong>.<strong>19</strong> 17.16 16.83 15.84<br />
85
![Our ref: [ ] - Sports Direct International](https://img.yumpu.com/19248141/1/184x260/our-ref-sports-direct-international.jpg?quality=85)


![Our ref: [ ] - Sports Direct International](https://img.yumpu.com/18440214/1/184x260/our-ref-sports-direct-international.jpg?quality=85)