Dave Forsey Chief Executive 19 July 2012 - Sports Direct International
Dave Forsey Chief Executive 19 July 2012 - Sports Direct International
Dave Forsey Chief Executive 19 July 2012 - Sports Direct International

Create successful ePaper yourself
Turn your PDF publications into a flip-book with our unique Google optimized e-Paper software.
98 / FINANCIAL STATEMENTS AND NOTES<br />
notes to the Financial Statements<br />
For the 53 weeks ended 29 April <strong>2012</strong><br />
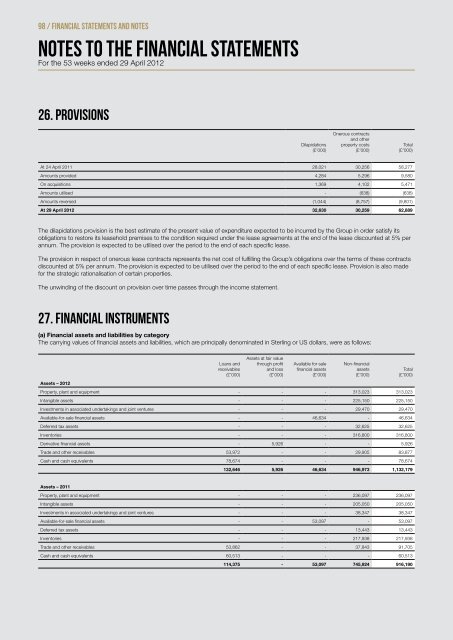
26. provisions<br />
Dilapidations<br />
(£’000)<br />
Onerous contracts<br />
and other<br />
property costs<br />
(£’000)<br />
At 24 April 2011 28,021 30,256 58,277<br />
Amounts provided 4,284 5,296 9,580<br />
On acquisitions 1,369 4,102 5,471<br />
Amounts utilised - (638) (638)<br />
Amounts reversed (1,044) (8,757) (9,801)<br />
At 29 April <strong>2012</strong> 32,630 30,259 62,889<br />
The dilapidations provision is the best estimate of the present value of expenditure expected to be incurred by the Group in order satisfy its<br />
obligations to restore its leasehold premises to the condition required under the lease agreements at the end of the lease discounted at 5% per<br />
annum. The provision is expected to be utilised over the period to the end of each specific lease.<br />
The provision in respect of onerous lease contracts represents the net cost of fulfilling the Group’s obligations over the terms of these contracts<br />
discounted at 5% per annum. The provision is expected to be utilised over the period to the end of each specific lease. Provision is also made<br />
for the strategic rationalisation of certain properties.<br />
The unwinding of the discount on provision over time passes through the income statement.<br />
27. Financial Instruments<br />
(a) Financial assets and liabilities by category<br />
The carrying values of financial assets and liabilities, which are principally denominated in Sterling or US dollars, were as follows:<br />
Assets – <strong>2012</strong><br />
Loans and<br />
receivables<br />
(£’000)<br />
Assets at fair value<br />
through profit<br />
and loss<br />
(£’000)<br />
Available for sale<br />
financial assets<br />
(£’000)<br />
Non-financial<br />
assets<br />
(£’000)<br />
Property, plant and equipment - - - 313,023 313,023<br />
Intangible assets - - - 225,150 225,150<br />
Investments in associated undertakings and joint ventures - - - 29,470 29,470<br />
Available-for-sale financial assets - - 46,634 - 46,634<br />
Deferred tax assets - - - 32,625 32,625<br />
Inventories - - - 316,800 316,800<br />
Derivative financial assets - 5,926 - - 5,926<br />
Trade and other receivables 53,972 - - 29,905 83,877<br />
Cash and cash equivalents 78,674 - - - 78,674<br />
Total<br />
(£’000)<br />
Total<br />
(£’000)<br />
132,646 5,926 46,634 946,973 1,132,179<br />
Assets – 2011<br />
Property, plant and equipment - - - 236,097 236,097<br />
Intangible assets - - - 205,050 205,050<br />
Investments in associated undertakings and joint ventures - - - 38,347 38,347<br />
Available-for-sale financial assets - - 53,097 - 53,097<br />
Deferred tax assets - - - 13,443 13,443<br />
Inventories - - - 217,938 217,938<br />
Trade and other receivables 53,862 - - 37,843 91,705<br />
Cash and cash equivalents 60,513 - - - 60,513<br />
114,375 - 53,097 745,924 916,<strong>19</strong>0
![Our ref: [ ] - Sports Direct International](https://img.yumpu.com/19248141/1/184x260/our-ref-sports-direct-international.jpg?quality=85)

![Our ref: [ ] - Sports Direct International](https://img.yumpu.com/18440214/1/184x260/our-ref-sports-direct-international.jpg?quality=85)