Dave Forsey Chief Executive 19 July 2012 - Sports Direct International
Dave Forsey Chief Executive 19 July 2012 - Sports Direct International
Dave Forsey Chief Executive 19 July 2012 - Sports Direct International

Create successful ePaper yourself
Turn your PDF publications into a flip-book with our unique Google optimized e-Paper software.
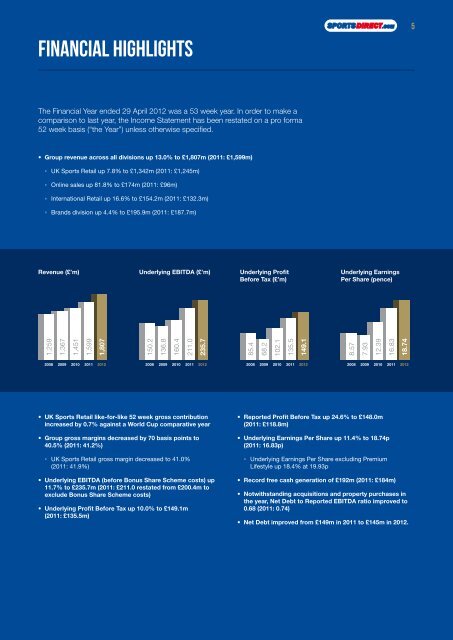
financial highlights<br />
The Financial Year ended 29 April <strong>2012</strong> was a 53 week year. In order to make a<br />
comparison to last year, the Income Statement has been restated on a pro forma<br />
52 week basis (“the Year”) unless otherwise specified.<br />
• Group revenue across all divisions up 13.0% to £1,807m (2011: £1,599m)<br />
◦ UK <strong>Sports</strong> Retail up 7.8% to £1,342m (2011: £1,245m)<br />
◦ Online sales up 81.8% to £174m (2011: £96m)<br />
◦ <strong>International</strong> Retail up 16.6% to £154.2m (2011: £132.3m)<br />
◦ Brands division up 4.4% to £<strong>19</strong>5.9m (2011: £187.7m)<br />
Revenue (£’m)<br />
1,259<br />
2008<br />
1,367<br />
2009<br />
1,451<br />
2010<br />
1,599<br />
2011<br />
1,807<br />
<strong>2012</strong><br />
Underlying EBITDA (£’m)<br />
150.2<br />
2008<br />
136.8<br />
2009<br />
160.4<br />
2010<br />
211.0<br />
2011<br />
235.7<br />
• UK <strong>Sports</strong> Retail like-for-like 52 week gross contribution<br />
increased by 0.7% against a World Cup comparative year<br />
• Group gross margins decreased by 70 basis points to<br />
40.5% (2011: 41.2%)<br />
◦ UK <strong>Sports</strong> Retail gross margin decreased to 41.0%<br />
(2011: 41.9%)<br />
• Underlying EBITDA (before Bonus Share Scheme costs) up<br />
11.7% to £235.7m (2011: £211.0 restated from £200.4m to<br />
exclude Bonus Share Scheme costs)<br />
• Underlying Profit Before Tax up 10.0% to £149.1m<br />
(2011: £135.5m)<br />
<strong>2012</strong><br />
Underlying Profit<br />
Before Tax (£’m)<br />
85.4<br />
2008<br />
68.2<br />
2009<br />
102.1<br />
2010<br />
135.5<br />
2011<br />
149.1<br />
<strong>2012</strong><br />
Underlying Earnings<br />
Per Share (pence)<br />
8.57<br />
2008<br />
7.93<br />
2009<br />
12.39<br />
2010<br />
• Reported Profit Before Tax up 24.6% to £148.0m<br />
(2011: £118.8m)<br />
• Underlying Earnings Per Share up 11.4% to 18.74p<br />
(2011: 16.83p)<br />
◦ Underlying Earnings Per Share excluding Premium<br />
Lifestyle up 18.4% at <strong>19</strong>.93p<br />
16.83<br />
2011<br />
• Record free cash generation of £<strong>19</strong>2m (2011: £184m)<br />
18.74<br />
• Notwithstanding acquisitions and property purchases in<br />
the year, Net Debt to Reported EBITDA ratio improved to<br />
0.68 (2011: 0.74)<br />
• Net Debt improved from £149m in 2011 to £145m in <strong>2012</strong>.<br />
<strong>2012</strong><br />
5
![Our ref: [ ] - Sports Direct International](https://img.yumpu.com/19248141/1/184x260/our-ref-sports-direct-international.jpg?quality=85)

![Our ref: [ ] - Sports Direct International](https://img.yumpu.com/18440214/1/184x260/our-ref-sports-direct-international.jpg?quality=85)