

Hydrogen Fuel Cell Bus Technology State of the ... - NEXTHYLIGHTS
Hydrogen Fuel Cell Bus Technology State of the ... - NEXTHYLIGHTS
Hydrogen Fuel Cell Bus Technology State of the ... - NEXTHYLIGHTS

You also want an ePaper? Increase the reach of your titles
YUMPU automatically turns print PDFs into web optimized ePapers that Google loves.
<strong>Hydrogen</strong> <strong>Fuel</strong> <strong>Cell</strong> <strong>Bus</strong> <strong>Technology</strong> <strong>State</strong> <strong>of</strong> <strong>the</strong> Art Review<br />
5.2 CO2 emissions<br />
Table 9, below, summarises <strong>the</strong> range <strong>of</strong> CO2 emissions per kilometre for hybrid fuel cell<br />
buses compared with diesel and diesel hybrid buses. There is a very wide range for fuel<br />
cell hybrids, reflecting <strong>the</strong> wide range in CO2 emissions for different hydrogen production<br />
pathways. At <strong>the</strong> ultra-low CO2 end (production from renewable, nuclear or fossils fuels<br />
with CCS) <strong>the</strong> CO2 emissions are over 90% lower than a conventional diesel bus.<br />
At today‟s state <strong>of</strong> <strong>the</strong> art for hydrogen production from methane (approx. 10kgCO2/kg <strong>of</strong><br />
H2), <strong>the</strong>re is still a CO2 advantage over both diesel and diesel hybrid buses at <strong>the</strong><br />
highest fuel economy for fuel cell buses (N.B.: next generation <strong>of</strong> FC buses are<br />
expected to achieve a fuel economy up to 40% better than diesel buses over an<br />
equivalent route at parity <strong>of</strong> calorific content). As <strong>the</strong> fuel economy drops from this point,<br />
or less efficient methane based reformation pathways are used, <strong>the</strong> CO2 emissions tend<br />
towards that <strong>of</strong> a conventional diesel bus and can even increase above those for hybrid<br />
diesel buses.<br />
This suggests that any medium term strategy for hydrogen bus rollout should target a<br />
CO2 content below 10kgCO2/kg <strong>of</strong> hydrogen and best in class fuel economy, to ensure<br />
that <strong>the</strong> deployment leads to real CO2 savings.<br />
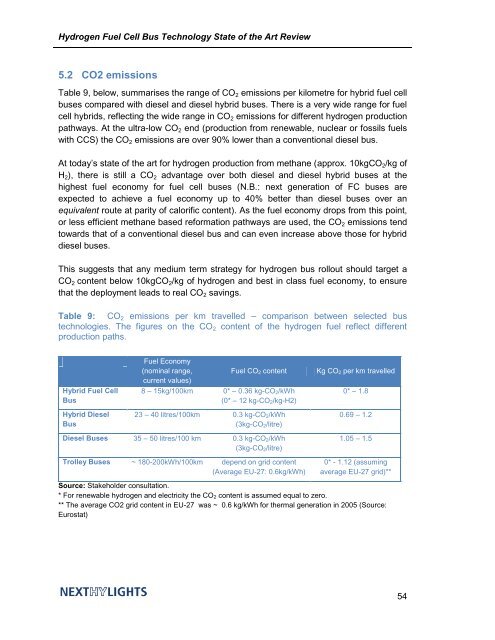
Table 9: CO2 emissions per km travelled – comparison between selected bus<br />
technologies. The figures on <strong>the</strong> CO2 content <strong>of</strong> <strong>the</strong> hydrogen fuel reflect different<br />
production paths.<br />
Hybrid <strong>Fuel</strong> <strong>Cell</strong><br />
<strong>Bus</strong><br />
Hybrid Diesel<br />
<strong>Bus</strong><br />
<strong>Fuel</strong> Economy<br />
(nominal range,<br />
current values)<br />
<strong>Fuel</strong> CO2 content Kg CO2 per km travelled<br />
8 – 15kg/100km 0* – 0.36 kg-CO2/kWh<br />
(0* – 12 kg-CO2/kg-H2)<br />
0* – 1.8<br />
23 – 40 litres/100km 0.3 kg-CO2/kWh<br />
(3kg-CO2/litre)<br />
Diesel <strong>Bus</strong>es 35 – 50 litres/100 km 0.3 kg-CO2/kWh<br />
(3kg-CO2/litre)<br />
Trolley <strong>Bus</strong>es ~ 180-200kWh/100km depend on grid content<br />
(Average EU-27: 0.6kg/kWh)<br />
0.69 – 1.2<br />
1.05 – 1.5<br />
0* - 1.12 (assuming<br />
average EU-27 grid)**<br />
Source: Stakeholder consultation.<br />
* For renewable hydrogen and electricity <strong>the</strong> CO2 content is assumed equal to zero.<br />
** The average CO2 grid content in EU-27 was ~ 0.6 kg/kWh for <strong>the</strong>rmal generation in 2005 (Source:<br />
Eurostat)<br />
54