

View PDF Version - RePub - Erasmus Universiteit Rotterdam
View PDF Version - RePub - Erasmus Universiteit Rotterdam
View PDF Version - RePub - Erasmus Universiteit Rotterdam

Create successful ePaper yourself
Turn your PDF publications into a flip-book with our unique Google optimized e-Paper software.
Discriminant analysis using a MLMM with a normal mixture 157<br />
a random intercept and time effects (time in months). That is, each matrix Z g<br />
i,r<br />
contains an intercept column and the column of the times at which the markers have<br />
been measured. Hence, in each prognostic group, there are 6-dimensional random<br />
effects. Weakly informative priors as described in Section ’Prior distributions’ have<br />
been used for the model parameters. Models with K = 1 and K = 2 mixture<br />
components have been fitted for comparative purposes. The reported results are<br />
based on 10 000 iterations of 1:10 thinned MCMC after a burn-in period of 5 000<br />
iterations. MCMC sampling took about 120s for Group 0 and about 30s for Group 1<br />
on an Intel Core 2 Duo 3 GHz CPU with 3.25 GB RAM. Convergence of the MCMC<br />
was evaluated using the R package coda (Plummer et al. 26 ).<br />
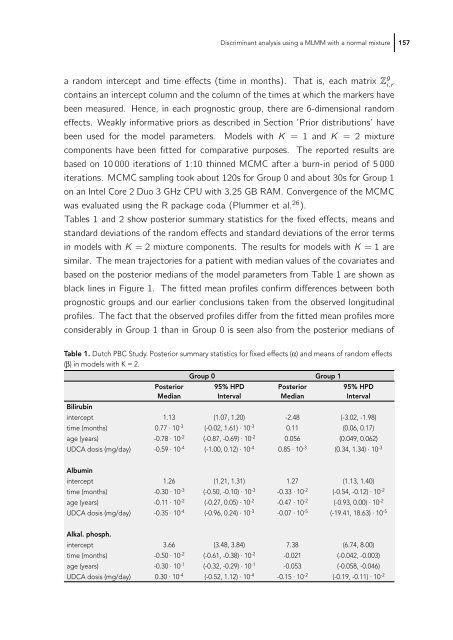
Tables 1 and 2 show posterior summary statistics for the fixed effects, means and<br />
standard deviations of the random effects and standard deviations of the error terms<br />
in models with K = 2 mixture components. The results for models with K =1are<br />
similar. The mean trajectories for a patient with median values of the covariates and<br />
based on the posterior medians of the model parameters from Table 1 are shown as<br />
black lines in Figure 1. The fitted mean profiles confirm differences between both<br />
prognostic groups and our earlier conclusions taken from the observed longitudinal<br />
profiles. The fact that the observed profiles differ from the fitted mean profiles more<br />
considerably in Group 1 than in Group 0 is seen also from the posterior medians of<br />
Table 1. Dutch PBC Study. Posterior summary statistics for fi xed effects (α) and means of random effects<br />
(β) in models with K = 2.<br />
Group 0 Group 1<br />
Posterior<br />
Median<br />
95% HPD<br />
Interval<br />
Posterior<br />
Median<br />
95% HPD<br />
Interval<br />
Bilirubin<br />
intercept 1.13 (1.07, 1.20) -2.48 (-3.02, -1.98)<br />
time (months) 0.77 · 10-3 (-0.02, 1.61) · 10-3 0.11 (0.06, 0.17)<br />
age (years) -0.78 · 10-2 (-0.87, -0.69) · 10-2 0.056 (0.049, 0.062)<br />
UDCA dosis (mg/day) -0.59 · 10-4 (-1.00, 0.12) · 10-4 0.85 · 10-3 (0.34, 1.34) · 10-3 Albumin<br />
intercept 1.26 (1.21, 1.31) 1.27 (1.13, 1.40)<br />
time (months) -0.30 · 10-3 (-0.50, -0.10) · 10-3 -0.33 · 10-2 (-0.54, -0.12) · 10-2 age (years) -0.11 · 10-2 (-0.27, 0.05) · 10-2 -0.47 · 10-2 (-0.93, 0.00) · 10-2 UDCA dosis (mg/day) -0.35 · 10-4 (-0.96, 0.24) · 10-3 -0.07 · 10-5 (-19.41, 18.63) · 10-5 Alkal. phosph.<br />
intercept 3.66 (3.48, 3.84) 7.38 (6.74, 8.00)<br />
time (months) -0.50 · 10-2 (-0.61, -0.38) · 10-2 -0.021 (-0.042, -0.003)<br />
age (years) -0.30 · 10-1 (-0.32, -0.29) · 10-1 -0.053 (-0.058, -0.046)<br />
UDCA dosis (mg/day) 0.30 · 10-4 (-0.52, 1.12) · 10-4 -0.15 · 10-2 (-0.19, -0.11) · 10-2


