

View PDF Version - RePub - Erasmus Universiteit Rotterdam
View PDF Version - RePub - Erasmus Universiteit Rotterdam
View PDF Version - RePub - Erasmus Universiteit Rotterdam

You also want an ePaper? Increase the reach of your titles
YUMPU automatically turns print PDFs into web optimized ePapers that Google loves.
Chapter 2.3<br />
68<br />
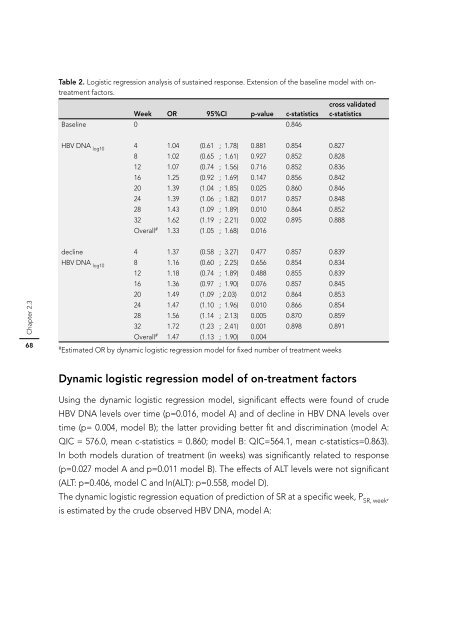
Table 2. Logistic regression analysis of sustained response. Extension of the baseline model with ontreatment<br />
factors.<br />
cross validated<br />
Week OR 95%CI p-value c-statistics c-statistics<br />
Baseline 0 0.846<br />
HBV DNA log10 4 1.04 (0.61 ; 1.78) 0.881 0.854 0.827<br />
8 1.02 (0.65 ; 1.61) 0.927 0.852 0.828<br />
12 1.07 (0.74 ; 1.56) 0.716 0.852 0.836<br />
16 1.25 (0.92 ; 1.69) 0.147 0.856 0.842<br />
20 1.39 (1.04 ; 1.85) 0.025 0.860 0.846<br />
24 1.39 (1.06 ; 1.82) 0.017 0.857 0.848<br />
28 1.43 (1.09 ; 1.89) 0.010 0.864 0.852<br />
32 1.62 (1.19 ; 2.21) 0.002 0.895 0.888<br />
Overall # 1.33 (1.05 ; 1.68) 0.016<br />
decline 4 1.37 (0.58 ; 3.27) 0.477 0.857 0.839<br />
HBV DNA log10 8 1.16 (0.60 ; 2.25) 0.656 0.854 0.834<br />
12 1.18 (0.74 ; 1.89) 0.488 0.855 0.839<br />
16 1.36 (0.97 ; 1.90) 0.076 0.857 0.845<br />
20 1.49 (1.09 ; 2.03) 0.012 0.864 0.853<br />
24 1.47 (1.10 ; 1.96) 0.010 0.866 0.854<br />
28 1.56 (1.14 ; 2.13) 0.005 0.870 0.859<br />
32 1.72 (1.23 ; 2.41) 0.001 0.898 0.891<br />
Overall # 1.47 (1.13 ; 1.90) 0.004<br />
# Estimated OR by dynamic logistic regression model for fi xed number of treatment weeks<br />
Dynamic logistic regression model of on-treatment factors<br />
Using the dynamic logistic regression model, signifi cant effects were found of crude<br />
HBV DNA levels over time (p=0.016, model A) and of decline in HBV DNA levels over<br />
time (p= 0.004, model B); the latter providing better fi t and discrimination (model A:<br />
QIC = 576.0, mean c-statistics = 0.860; model B: QIC=564.1, mean c-statistics=0.863).<br />
In both models duration of treatment (in weeks) was signifi cantly related to response<br />
(p=0.027 model A and p=0.011 model B). The effects of ALT levels were not signifi cant<br />
(ALT: p=0.406, model C and ln(ALT): p=0.558, model D).<br />
The dynamic logistic regression equation of prediction of SR at a specifi c week, PSR, week ,<br />
is estimated by the crude observed HBV DNA, model A:


