

View PDF Version - RePub - Erasmus Universiteit Rotterdam
View PDF Version - RePub - Erasmus Universiteit Rotterdam
View PDF Version - RePub - Erasmus Universiteit Rotterdam

Create successful ePaper yourself
Turn your PDF publications into a flip-book with our unique Google optimized e-Paper software.
Chapter 4.1<br />
180<br />
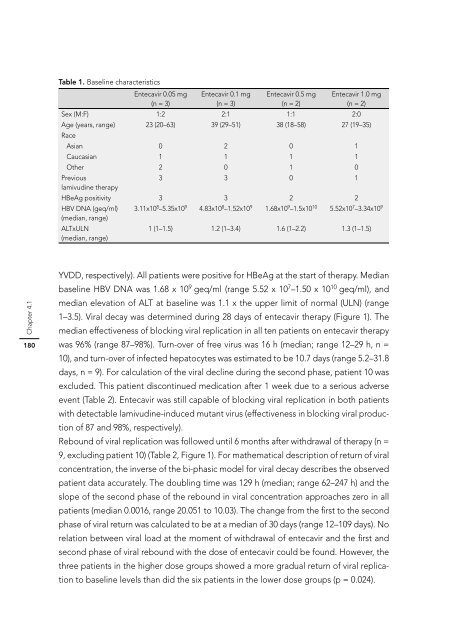
Table 1. Baseline characteristics<br />
Entecavir 0.05 mg Entecavir 0.1 mg Entecavir 0.5 mg Entecavir 1.0 mg<br />
(n = 3)<br />
(n = 3)<br />
(n = 2)<br />
(n = 2)<br />
Sex (M:F) 1:2 2:1 1:1 2:0<br />
Age (years, range)<br />
Race<br />
23 (20–63) 39 (29–51) 38 (18–58) 27 (19–35)<br />
Asian 0 2 0 1<br />
Caucasian 1 1 1 1<br />
Other 2 0 1 0<br />
Previous<br />
lamivudine therapy<br />
3 3 0 1<br />
HBeAg positivity 3 3 2 2<br />
HBV DNA (geq/ml)<br />
(median, range)<br />
3.11x10⁸ –5.35x10⁹ 4.83x10⁸ –1.52x10⁹ 1.68x10⁹ –1.5x10¹⁰ 5.52x10⁷ –3.34x10⁹ ALTxULN<br />
(median, range)<br />
1 (1–1.5) 1.2 (1–3.4) 1.6 (1–2.2) 1.3 (1–1.5)<br />
YVDD, respectively). All patients were positive for HBeAg at the start of therapy. Median<br />
baseline HBV DNA was 1.68 x 10⁹ geq/ml (range 5.52 x 10⁷ –1.50 x 10 10 geq/ml), and<br />
median elevation of ALT at baseline was 1.1 x the upper limit of normal (ULN) (range<br />
1–3.5). Viral decay was determined during 28 days of entecavir therapy (Figure 1). The<br />
median effectiveness of blocking viral replication in all ten patients on entecavir therapy<br />
was 96% (range 87–98%). Turn-over of free virus was 16 h (median; range 12–29 h, n =<br />
10), and turn-over of infected hepatocytes was estimated to be 10.7 days (range 5.2–31.8<br />
days, n = 9). For calculation of the viral decline during the second phase, patient 10 was<br />
excluded. This patient discontinued medication after 1 week due to a serious adverse<br />
event (Table 2). Entecavir was still capable of blocking viral replication in both patients<br />
with detectable lamivudine-induced mutant virus (effectiveness in blocking viral production<br />
of 87 and 98%, respectively).<br />
Rebound of viral replication was followed until 6 months after withdrawal of therapy (n =<br />
9, excluding patient 10) (Table 2, Figure 1). For mathematical description of return of viral<br />
concentration, the inverse of the bi-phasic model for viral decay describes the observed<br />
patient data accurately. The doubling time was 129 h (median; range 62–247 h) and the<br />
slope of the second phase of the rebound in viral concentration approaches zero in all<br />
patients (median 0.0016, range 20.051 to 10.03). The change from the fi rst to the second<br />
phase of viral return was calculated to be at a median of 30 days (range 12–109 days). No<br />
relation between viral load at the moment of withdrawal of entecavir and the fi rst and<br />
second phase of viral rebound with the dose of entecavir could be found. However, the<br />
three patients in the higher dose groups showed a more gradual return of viral replication<br />
to baseline levels than did the six patients in the lower dose groups (p = 0.024).


