View PDF Version - RePub - Erasmus Universiteit Rotterdam
View PDF Version - RePub - Erasmus Universiteit Rotterdam
View PDF Version - RePub - Erasmus Universiteit Rotterdam
Create successful ePaper yourself
Turn your PDF publications into a flip-book with our unique Google optimized e-Paper software.
Dynamic prediction of response using longitudinal profi les 91<br />
Results of the longitudinal prediction with the direct approach<br />
First the result of the logistic regression method is presented. In a previous study13,14 of the response to therapy a prognostic model of baseline factors were designed and<br />
validated, and a alongside prognostic indexes (PI0) were calculated (as described<br />
in Section 3). In this updating pooled logistic regression model the subject specific<br />
PI’s are used as offsets. The final model to predict response using the data of all<br />
patients, n=125 and the repeated measurements of the load and the ALT the first<br />
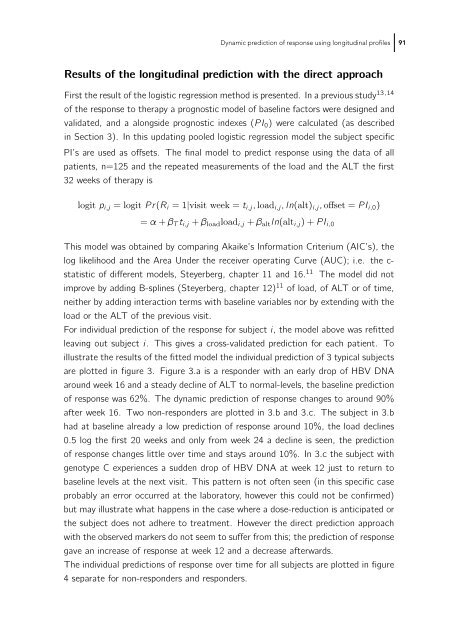
32 weeks of therapy is<br />
logit pi,j = logit Pr(Ri =1|visit week = ti,j, loadi,j,ln(alt)i,j, offset = PIi,0)<br />
= α + βT ti,j + βloadloadi,j + βaltln(alti,j)+PIi,0<br />
This model was obtained by comparing Akaike’s Information Criterium (AIC’s), the<br />
log likelihood and the Area Under the receiver operating Curve (AUC); i.e. the cstatistic<br />
of different models, Steyerberg, chapter 11 and 16. 11 The model did not<br />
improve by adding B-splines (Steyerberg, chapter 12) 11 of load, of ALT or of time,<br />
neither by adding interaction terms with baseline variables nor by extending with the<br />
load or the ALT of the previous visit.<br />
For individual prediction of the response for subject i, the model above was refitted<br />
leaving out subject i. This gives a cross-validated prediction for each patient. To<br />
illustrate the results of the fitted model the individual prediction of 3 typical subjects<br />
are plotted in figure 3. Figure 3.a is a responder with an early drop of HBV DNA<br />
around week 16 and a steady decline of ALT to normal-levels, the baseline prediction<br />
of response was 62%. The dynamic prediction of response changes to around 90%<br />
after week 16. Two non-responders are plotted in 3.b and 3.c. The subject in 3.b<br />
had at baseline already a low prediction of response around 10%, the load declines<br />
0.5 log the first 20 weeks and only from week 24 a decline is seen, the prediction<br />
of response changes little over time and stays around 10%. In 3.c the subject with<br />
genotype C experiences a sudden drop of HBV DNA at week 12 just to return to<br />
baseline levels at the next visit. This pattern is not often seen (in this specific case<br />
probably an error occurred at the laboratory, however this could not be confirmed)<br />
but may illustrate what happens in the case where a dose-reduction is anticipated or<br />
the subject does not adhere to treatment. However the direct prediction approach<br />
with the observed markers do not seem to suffer from this; the prediction of response<br />
gave an increase of response at week 12 and a decrease afterwards.<br />
The individual predictions of response over time for all subjects are plotted in figure<br />
4 separate for non-responders and responders.


