

View PDF Version - RePub - Erasmus Universiteit Rotterdam
View PDF Version - RePub - Erasmus Universiteit Rotterdam
View PDF Version - RePub - Erasmus Universiteit Rotterdam

Create successful ePaper yourself
Turn your PDF publications into a flip-book with our unique Google optimized e-Paper software.
Discriminant analysis using a MLMM with a normal mixture 163<br />
Table 3. Dutch PBC Study, random effect prediction with K=1 and K=2 mixture components. Sensitivity<br />
of the prediction at t=0, 6, 12, 18, 24, 36, 48, 60 months for specifi city of 0.99,0.95, 0.90.<br />
Specifi city<br />
0.99 0.95 0.90<br />
K=1 K=2 K=1 K=2 K=1 K=2<br />
Time Sensitivity<br />
0 months 0.152 0.212 0.545 0.515 0.606 0.667<br />
6 months 0.175 0.175 0.450 0.425 0.675 0.725<br />
12 months 0.081 0.216 0.541 0.486 0.649 0.811<br />
18 months 0.033 0.267 0.467 0.433 0.600 0.733<br />
24 months 0.034 0.414 0.552 0.552 0.759 0.828<br />
36 months 0.115 0.500 0.577 0.692 0.731 0.808<br />
48 months 0.381 0.619 0.619 0.667 0.667 0.810<br />
60 months 0.429 0.500 0.643 0.714 0.714 0.857<br />
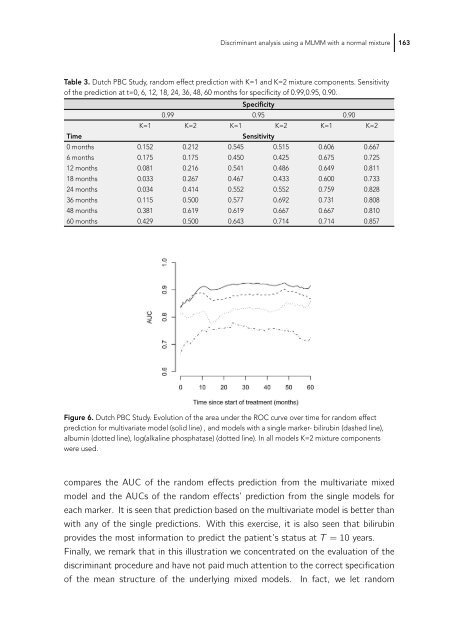
Figure 6. Dutch PBC Study. Evolution of the area under the ROC curve over time for random effect<br />
prediction for multivariate model (solid line) , and models with a single marker- bilirubin (dashed line),<br />
albumin (dotted line), log(alkaline phosphatase) (dotted line). In all models K=2 mixture components<br />
were used.<br />
compares the AUC of the random effects prediction from the multivariate mixed<br />
model and the AUCs of the random effects’ prediction from the single models for<br />
each marker. It is seen that prediction based on the multivariate model is better than<br />
with any of the single predictions. With this exercise, it is also seen that bilirubin<br />
provides the most information to predict the patient’s status at T =10years.<br />
Finally, we remark that in this illustration we concentrated on the evaluation of the<br />
discriminant procedure and have not paid much attention to the correct specification<br />
of the mean structure of the underlying mixed models. In fact, we let random


