

View PDF Version - RePub - Erasmus Universiteit Rotterdam
View PDF Version - RePub - Erasmus Universiteit Rotterdam
View PDF Version - RePub - Erasmus Universiteit Rotterdam

Create successful ePaper yourself
Turn your PDF publications into a flip-book with our unique Google optimized e-Paper software.
Chapter 2.3<br />
70<br />
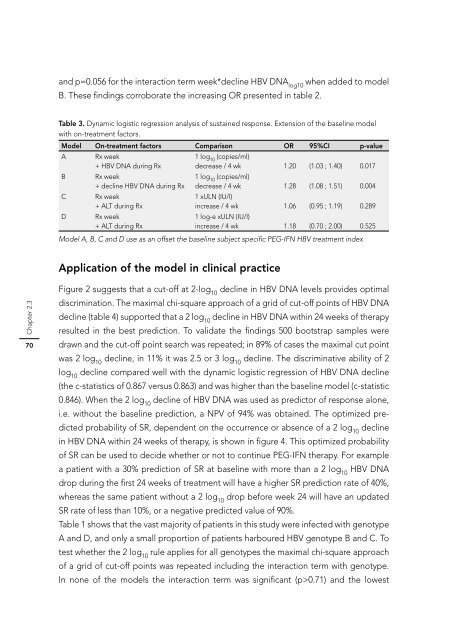
and p=0.056 for the interaction term week*decline HBV DNA log10 when added to model<br />
B. These fi ndings corroborate the increasing OR presented in table 2.<br />
Table 3. Dynamic logistic regression analysis of sustained response. Extension of the baseline model<br />
with on-treatment factors.<br />
Model On-treatment factors Comparison OR 95%CI p-value<br />
A Rx week<br />
+ HBV DNA during Rx<br />
B Rx week<br />
+ decline HBV DNA during Rx<br />
C Rx week<br />
+ ALT during Rx<br />
D Rx week<br />
+ ALT during Rx<br />
1 log10 (copies/ml)<br />
decrease / 4 wk<br />
1 log10 (copies/ml)<br />
1.20 (1.03 ; 1.40) 0.017<br />
decrease / 4 wk<br />
1 xULN (IU/l)<br />
1.28 (1.08 ; 1.51) 0.004<br />
increase / 4 wk<br />
1 log-e xULN (IU/l)<br />
1.06 (0.95 ; 1.19) 0.289<br />
increase / 4 wk 1.18 (0.70 ; 2.00) 0.525<br />
Model A, B, C and D use as an offset the baseline subject specifi c PEG-IFN HBV treatment index<br />
Application of the model in clinical practice<br />
Figure 2 suggests that a cut-off at 2-log10 decline in HBV DNA levels provides optimal<br />
discrimination. The maximal chi-square approach of a grid of cut-off points of HBV DNA<br />
decline (table 4) supported that a 2 log10 decline in HBV DNA within 24 weeks of therapy<br />
resulted in the best prediction. To validate the fi ndings 500 bootstrap samples were<br />
drawn and the cut-off point search was repeated; in 89% of cases the maximal cut point<br />
was 2 log10 decline, in 11% it was 2.5 or 3 log10 decline. The discriminative ability of 2<br />
log10 decline compared well with the dynamic logistic regression of HBV DNA decline<br />
(the c-statistics of 0.867 versus 0.863) and was higher than the baseline model (c-statistic<br />
0.846). When the 2 log10 decline of HBV DNA was used as predictor of response alone,<br />
i.e. without the baseline prediction, a NPV of 94% was obtained. The optimized predicted<br />
probability of SR, dependent on the occurrence or absence of a 2 log10 decline<br />
in HBV DNA within 24 weeks of therapy, is shown in fi gure 4. This optimized probability<br />
of SR can be used to decide whether or not to continue PEG-IFN therapy. For example<br />
a patient with a 30% prediction of SR at baseline with more than a 2 log10 HBV DNA<br />
drop during the fi rst 24 weeks of treatment will have a higher SR prediction rate of 40%,<br />
whereas the same patient without a 2 log10 drop before week 24 will have an updated<br />
SR rate of less than 10%, or a negative predicted value of 90%.<br />
Table 1 shows that the vast majority of patients in this study were infected with genotype<br />
A and D, and only a small proportion of patients harboured HBV genotype B and C. To<br />
test whether the 2 log10 rule applies for all genotypes the maximal chi-square approach<br />
of a grid of cut-off points was repeated including the interaction term with genotype.<br />
In none of the models the interaction term was signifi cant (p>0.71) and the lowest


