Download the file. - Groupe SEB
Download the file. - Groupe SEB
Download the file. - Groupe SEB

Create successful ePaper yourself
Turn your PDF publications into a flip-book with our unique Google optimized e-Paper software.
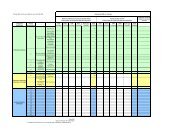
G R O U P E S E B I N F I G U R E S<br />
14-15<br />
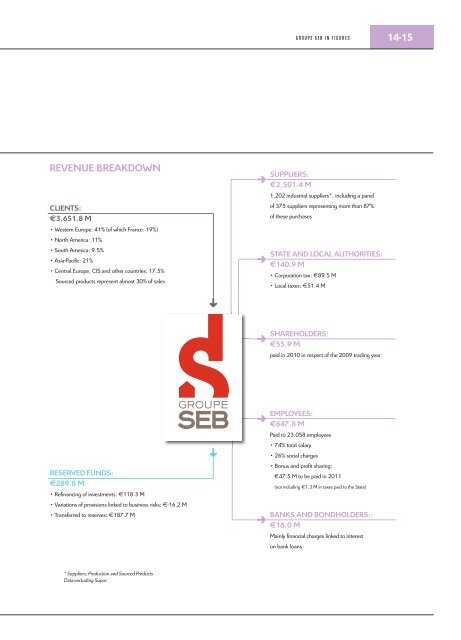
REVENUE BREAKDOWN<br />
CLIENTS:<br />
€3,651.8 M<br />
• Western Europe: 41% (of which France: 19%)<br />
• North America: 11%<br />
• South America: 9.5%<br />
• Asia-Pacic: 21%<br />
• Central Europe, CIS and o<strong>the</strong>r countries: 17.5%<br />
Sourced products represent almost 30% of sales<br />
SUPPLIERS:<br />
€2,501.4 M<br />
1,202 industrial suppliers*, including a panel<br />
of 375 suppliers representing more than 87%<br />
of <strong>the</strong>se purchases<br />
STATE AND LOCAL AUTHORITIES:<br />
€140.9 M<br />
• Corporation tax: €89.5 M<br />
• Local taxes: €51.4 M<br />
SHAREHOLDERS:<br />
€55.9 M<br />
paid in 2010 in respect of <strong>the</strong> 2009 trading year<br />
RESERVED fUNDS:<br />
€289.8 M<br />
• Renancing of investments: €118.3 M<br />
• Variations of provisions linked to business risks: €-16.2 M<br />
• Transferred to reserves: €187.7 M<br />
EMPLOYEES:<br />
€647.8 M<br />
Paid to 23,058 employees<br />
• 74% total salary<br />
• 26% social charges<br />
• Bonus and prot sharing:<br />
€47.5 M to be paid in 2011<br />
(not including €1.3 M in taxes paid to <strong>the</strong> State)<br />
BANKS AND BONDHOLDERS::<br />
€16.0 M<br />
Mainly nancial charges linked to interest<br />
on bank loans<br />
* Suppliers, Production and Sourced Products<br />
Data excluding Supor.