annual report annual report annual report annual report 2005
annual report annual report annual report annual report 2005
annual report annual report annual report annual report 2005

You also want an ePaper? Increase the reach of your titles
YUMPU automatically turns print PDFs into web optimized ePapers that Google loves.
122<br />
MATERIAL ENGINEERING, STRUCTURAL STUDIES, DIAGNOSTICS<br />
Table. Description of the analysed samples.<br />
and then predefined volumes from obtained solutions<br />
(0.01-0.1 ml) were drawn to glass flat measuring<br />
vessels and evaporated to dryness.<br />
Measurements of activity of the samples and<br />
standards prepared in such a way were carried out<br />
using an HP germanium detector with an active volume<br />
of 80 cm 3 and an energy resolving of 1.95 keV<br />
for 1333 keV 60 Co. The detector cooperates with a<br />
S100 Canberra analyser, controlled by IBM/PS-2.<br />
The analysis of complex gamma radiation spectra<br />
was carried out using a micro-SAMPO program.<br />
Eight measurements for each sample were performed.<br />
Forty elements were identified and determined<br />
in the analysed samples.<br />
Ultimately, 28 elements were selected for a<br />
multi-parameter statistical analysis aimed at identifying<br />
the degree of similarity of analysed icons.<br />
The clustering analysis using STATISTICA (Stat-<br />
Soft) program was carried out to identify the similarity<br />
degree of analysed objects. Distances between<br />
objects in the characteristic space (space<br />
dimension equals the number of characteristic features)<br />
are a direct point of entry for the clustering<br />
analysis. Every object can be described using some<br />
features that can be presented as real numbers –<br />
in our case it was the concentration of elements in<br />
the particular lead white sample. Similarity between<br />
the analysed samples can be determined based on<br />
the distribution of points in multidimensional space.<br />
Hierarchical object clustering methods are used<br />
most frequently. This allows to obtain a structure<br />
arranged in a hierarchy, with increasing distance<br />
corresponding to decreasing similarity. The result<br />
is presented in form of a dendrogram (clustering<br />
tree). The clustering analysis was carried out for<br />
standardised variables.<br />
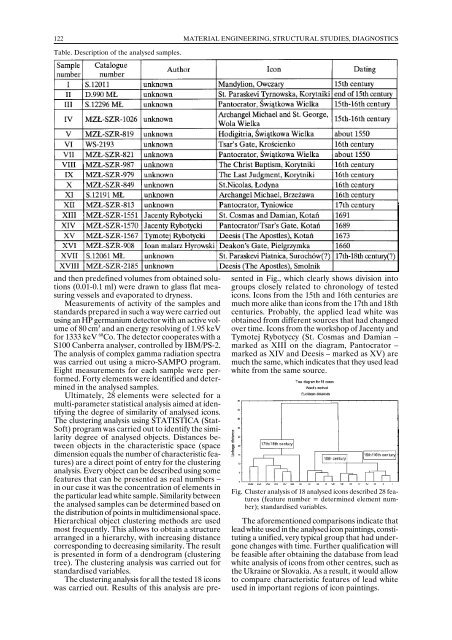
The clustering analysis for all the tested 18 icons<br />
was carried out. Results of this analysis are presented<br />
in Fig., which clearly shows division into<br />
groups closely related to chronology of tested<br />
icons. Icons from the 15th and 16th centuries are<br />
much more alike than icons from the 17th and 18th<br />
centuries. Probably, the applied lead white was<br />
obtained from different sources that had changed<br />
over time. Icons from the workshop of Jacenty and<br />
Tymotej Rybotyccy (St. Cosmas and Damian –<br />
marked as XIII on the diagram, Pantocrator –<br />
marked as XIV and Deesis – marked as XV) are<br />
much the same, which indicates that they used lead<br />
white from the same source.<br />
Fig. Cluster analysis of 18 analysed icons described 28 features<br />
(feature number = determined element number);<br />
standardised variables.<br />
The aforementioned comparisons indicate that<br />
lead white used in the analysed icon paintings, constituting<br />
a unified, very typical group that had undergone<br />
changes with time. Further qualification will<br />
be feasible after obtaining the database from lead<br />
white analysis of icons from other centres, such as<br />
the Ukraine or Slovakia. As a result, it would allow<br />
to compare characteristic features of lead white<br />
used in important regions of icon paintings.