annual report annual report annual report annual report 2005
annual report annual report annual report annual report 2005
annual report annual report annual report annual report 2005

Create successful ePaper yourself
Turn your PDF publications into a flip-book with our unique Google optimized e-Paper software.
80<br />
RADIOCHEMISTRY, STABLE ISOTOPES,<br />
NUCLEAR ANALYTICAL METHODS, GENERAL CHEMISTRY<br />
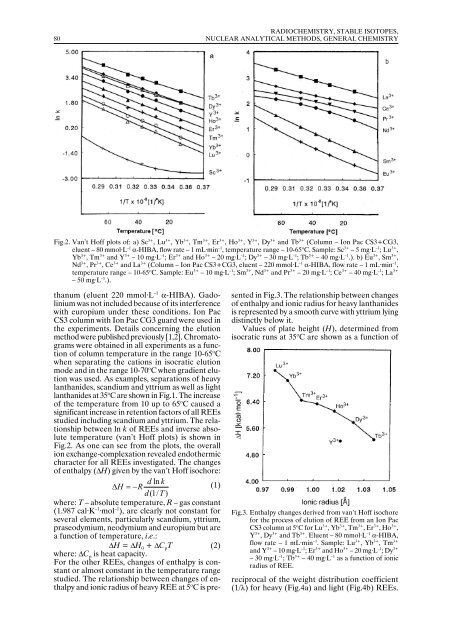
Fig.2. Van’t Hoff plots of: a) Sc 3+ , Lu 3+ , Yb 3+ , Tm 3+ , Er 3+ , Ho 3+ , Y 3+ , Dy 3+ and Tb 3+ (Column – Ion Pac CS3+CG3,<br />
eluent – 80 mmol·L –1 α-HIBA, flow rate – 1 mL·min –1 , temperature range – 10-65 o C. Sample: Sc 3+ – 5 mg·L –1 ; Lu 3+ ,<br />
Yb 3+ , Tm 3+ and Y 3+ – 10 mg·L –1 ; Er 3+ and Ho 3+ – 20 mg·L –1 ; Dy 3+ – 30 mg·L –1 ; Tb 3+ – 40 mg·L –1 .). b) Eu 3+ , Sm 3+ ,<br />
Nd 3+ , Pr 3+ , Ce 3+ and La 3+ (Column – Ion Pac CS3+CG3, eluent – 220 mmol·L –1 α-HIBA, flow rate – 1 mL·min –1 ,<br />
temperature range – 10-65 o C. Sample: Eu 3+ – 10 mg·L –1 ; Sm 3+ , Nd 3+ and Pr 3+ – 20 mg·L –1 ; Ce 3+ – 40 mg·L –1 ; La 3+<br />
– 50 mg·L –1 .).<br />
thanum (eluent 220 mmol·L –1 α-HIBA). Gadolinium<br />
was not included because of its interference<br />
with europium under these conditions. Ion Pac<br />
CS3 column with Ion Pac CG3 guard were used in<br />
the experiments. Details concerning the elution<br />
method were published previously [1,2]. Chromatograms<br />
were obtained in all experiments as a function<br />
of column temperature in the range 10-65 o C<br />
when separating the cations in isocratic elution<br />
mode and in the range 10-70 o C when gradient elution<br />
was used. As examples, separations of heavy<br />
lanthanides, scandium and yttrium as well as light<br />
lanthanides at 35 o C are shown in Fig.1. The increase<br />
of the temperature from 10 up to 65 o C caused a<br />
significant increase in retention factors of all REEs<br />
studied including scandium and yttrium. The relationship<br />
between ln k of REEs and inverse absolute<br />
temperature (van’t Hoff plots) is shown in<br />
Fig.2. As one can see from the plots, the overall<br />
ion exchange-complexation revealed endothermic<br />
character for all REEs investigated. The changes<br />
of enthalpy (∆H) given by the van’t Hoff isochore:<br />
dln<br />
k<br />
∆ H =−R (1)<br />
d (1/ T )<br />
where: T – absolute temperature, R – gas constant<br />
(1.987 cal·K –1·mol–1 ), are clearly not constant for<br />
several elements, particularly scandium, yttrium,<br />
praseodymium, neodymium and europium but are<br />
a function of temperature, i.e.:<br />
∆H = ∆H 0 + ∆C p T (2)<br />
where: ∆C p<br />
is heat capacity.<br />
For the other REEs, changes of enthalpy is constant<br />
or almost constant in the temperature range<br />
studied. The relationship between changes of enthalpy<br />
and ionic radius of heavy REE at 5 o C is presented<br />
in Fig.3. The relationship between changes<br />
of enthalpy and ionic radius for heavy lanthanides<br />
is represented by a smooth curve with yttrium lying<br />
distinctly below it.<br />
Values of plate height (H), determined from<br />
isocratic runs at 35 o C are shown as a function of<br />
Fig.3. Enthalpy changes derived from van’t Hoff isochore<br />
for the process of elution of REE from an Ion Pac<br />
CS3 column at 5 o C for Lu 3+ , Yb 3+ , Tm 3+ , Er 3+ , Ho 3+ ,<br />
Y 3+ , Dy 3+ and Tb 3+ . Eluent – 80 mmol·L –1 α-HIBA,<br />
flow rate – 1 mL·min –1 . Sample: Lu 3+ , Yb 3+ , Tm 3+<br />
and Y 3+ – 10 mg·L –1 ; Er 3+ and Ho 3+ – 20 mg·L –1 ; Dy 3+<br />
– 30 mg·L –1 ; Tb 3+ – 40 mg·L –1 as a function of ionic<br />
radius of REE.<br />
reciprocal of the weight distribution coefficient<br />
(1/λ) for heavy (Fig.4a) and light (Fig.4b) REEs.