annual report annual report annual report annual report 2005
annual report annual report annual report annual report 2005
annual report annual report annual report annual report 2005

Create successful ePaper yourself
Turn your PDF publications into a flip-book with our unique Google optimized e-Paper software.
NUCLEAR TECHNOLOGIES AND METHODS 133<br />
References<br />
[1]. Macedo A., Vaz C.M.P., Pereira J.C.D., Naime J.M.,<br />
Cruvinel P.E., Crestana S.: Holzforschung, 56, 2,<br />
535-540 (2002).<br />
[2]. Eckelman C.A.: Wood moisture calculations. www.ces.<br />
purdue.edu/extmedia/FNR/FNR-156.html.<br />
[3]. Laufenberg T.L.: Forest Prod. J., 36, 2, 59-62 (1986).<br />
[4]. Mankowski P., Gierlik E., Dzbeński W.: Badanie rozkładu<br />
gęstości drewna metodami radiometrycznymi.<br />
www.-rak.sggw.waw.pl/~1mankowski/r-gest-dr/r-gestdr.html<br />
(in Polish).<br />
APPLICATION OF THE BOOTSTRAP<br />
FOR ASSESSMENT OF RESULTS<br />
FROM INTERLABORATORY COMPARISON<br />
Ewa Kowalska, Piotr Urbański<br />
parisons of data obtained for the determination<br />
of iron in the reference material: Mixed Polish<br />
Herbs and Tea Leaves. Preparation of the material<br />
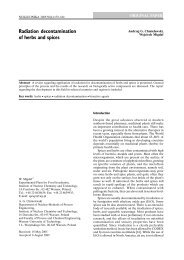
Fig.1. Cumulative distribution of the results of iron content in tea leaves: a – the whole set of 92 results; b – results for<br />
particular analytical methods: A0 – AAS general, A1 – AAS flame technique, E2 – AES (ICP), N1 – INAA<br />
(thermal neutrons).<br />
Investigations performed by some authors [1]<br />
have shown that statistical distribution of the results<br />
taken from interlaboratory comparisons often<br />
cannot be approximated by the normal probability<br />
function. In some cases, attempts to approximate<br />
them by other distribution functions<br />
(e.g. Weibull) also failed [2]. In such situations<br />
and organization of the interlaboratory comparison<br />
were performed by the Department of Analytical<br />
Chemistry (Institute of Nuclear Chemistry<br />
and Technology) [5,6].<br />
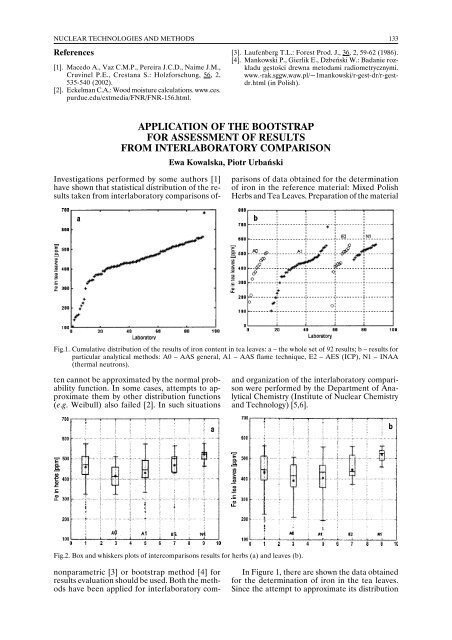
Fig.2. Box and whiskers plots of intercomparisons results for herbs (a) and leaves (b).<br />
nonparametric [3] or bootstrap method [4] for<br />
results evaluation should be used. Both the methods<br />
have been applied for interlaboratory com-<br />
In Figure 1, there are shown the data obtained<br />
for the determination of iron in the tea leaves.<br />
Since the attempt to approximate its distribution