- Page 1 and 2:
ANNUAL REPORT 2005 50 years in the
- Page 3 and 4:
CONTENTS GENERAL INFORMATION 9 MANA
- Page 5 and 6:
DETERMINATION OF CADMIUM, LEAD, COP
- Page 7 and 8:
NUCLEONIC CONTROL SYSTEMS AND ACCEL
- Page 9 and 10:
GENERAL INFORMATION 9 GENERAL INFOR
- Page 11 and 12:
MANAGEMENT OF THE INSTITUTE 11 MANA
- Page 13 and 14:
MANAGEMENT OF THE INSTITUTE 13 •
- Page 15 and 16:
SCIENTIFIC STAFF 15 5. Danilczuk Ma
- Page 17 and 18:
RADIATION CHEMISTRY AND PHYSICS, RA
- Page 19 and 20:
20 RADIATION CHEMISTRY AND PHYSICS,
- Page 21 and 22:
22 RADIATION CHEMISTRY AND PHYSICS,
- Page 23 and 24:
24 RADIATION CHEMISTRY AND PHYSICS,
- Page 25 and 26:
26 RADIATION CHEMISTRY AND PHYSICS,
- Page 27 and 28:
28 RADIATION CHEMISTRY AND PHYSICS,
- Page 29 and 30:
30 RADIATION CHEMISTRY AND PHYSICS,
- Page 31 and 32:
32 RADIATION CHEMISTRY AND PHYSICS,
- Page 33 and 34:
34 RADIATION CHEMISTRY AND PHYSICS,
- Page 35 and 36:
36 RADIATION CHEMISTRY AND PHYSICS,
- Page 37 and 38:
38 RADIATION CHEMISTRY AND PHYSICS,
- Page 39 and 40:
40 RADIATION CHEMISTRY AND PHYSICS,
- Page 41 and 42:
42 RADIATION CHEMISTRY AND PHYSICS,
- Page 43 and 44:
44 RADIATION CHEMISTRY AND PHYSICS,
- Page 45 and 46:
46 RADIATION CHEMISTRY AND PHYSICS,
- Page 47 and 48: 48 RADIATION CHEMISTRY AND PHYSICS,
- Page 49 and 50: 50 RADIATION CHEMISTRY AND PHYSICS,
- Page 51 and 52: 52 RADIATION CHEMISTRY AND PHYSICS,
- Page 53 and 54: 54 RADIATION CHEMISTRY AND PHYSICS,
- Page 55 and 56: 56 RADIATION CHEMISTRY AND PHYSICS,
- Page 57 and 58: RADIOCHEMISTRY, STABLE ISOTOPES, NU
- Page 59 and 60: RADIOCHEMISTRY, STABLE ISOTOPES, NU
- Page 61 and 62: RADIOCHEMISTRY, STABLE ISOTOPES, NU
- Page 63 and 64: RADIOCHEMISTRY, STABLE ISOTOPES, NU
- Page 65 and 66: RADIOCHEMISTRY, STABLE ISOTOPES, NU
- Page 67 and 68: RADIOCHEMISTRY, STABLE ISOTOPES, NU
- Page 69 and 70: RADIOCHEMISTRY, STABLE ISOTOPES, NU
- Page 71 and 72: RADIOCHEMISTRY, STABLE ISOTOPES, NU
- Page 73 and 74: RADIOCHEMISTRY, STABLE ISOTOPES, NU
- Page 75 and 76: RADIOCHEMISTRY, STABLE ISOTOPES, NU
- Page 77 and 78: RADIOCHEMISTRY, STABLE ISOTOPES, NU
- Page 79 and 80: RADIOCHEMISTRY, STABLE ISOTOPES, NU
- Page 81 and 82: RADIOCHEMISTRY, STABLE ISOTOPES, NU
- Page 83 and 84: RADIOCHEMISTRY, STABLE ISOTOPES, NU
- Page 85 and 86: RADIOCHEMISTRY, STABLE ISOTOPES, NU
- Page 87 and 88: RADIOCHEMISTRY, STABLE ISOTOPES, NU
- Page 89 and 90: RADIOCHEMISTRY, STABLE ISOTOPES, NU
- Page 91 and 92: RADIOCHEMISTRY, STABLE ISOTOPES, NU
- Page 93 and 94: RADIOCHEMISTRY, STABLE ISOTOPES, NU
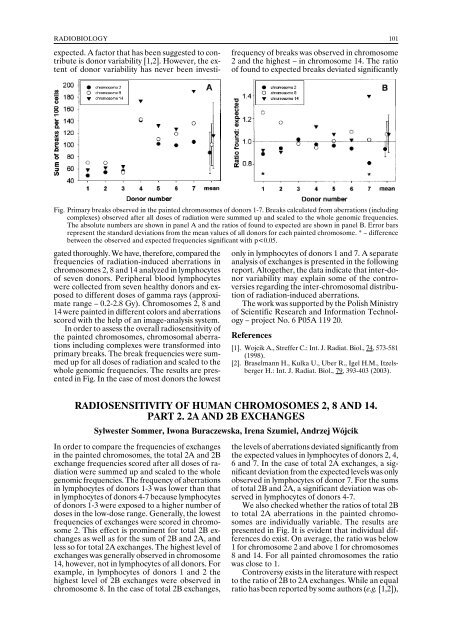
- Page 95 and 96: RADIOBIOLOGY
- Page 97: 100 RADIOBIOLOGY THE ROLE OF LYSOSO
- Page 101 and 102: 104 RADIOBIOLOGY DNA INTER-STRAND C
- Page 103 and 104: 106 SIRTUIN INHIBITION INCREASES TH
- Page 105 and 106: 108 The possible reason of this eff
- Page 107 and 108: NUCLEAR TECHNOLOGIES AND METHODS 11
- Page 109 and 110: NUCLEAR TECHNOLOGIES AND METHODS 11
- Page 111 and 112: NUCLEAR TECHNOLOGIES AND METHODS 11
- Page 113 and 114: NUCLEAR TECHNOLOGIES AND METHODS 11
- Page 115 and 116: NUCLEAR TECHNOLOGIES AND METHODS 11
- Page 117 and 118: NUCLEAR TECHNOLOGIES AND METHODS 12
- Page 119 and 120: NUCLEAR TECHNOLOGIES AND METHODS 12
- Page 121 and 122: NUCLEAR TECHNOLOGIES AND METHODS 12
- Page 123 and 124: NUCLEAR TECHNOLOGIES AND METHODS 12
- Page 125 and 126: NUCLEAR TECHNOLOGIES AND METHODS 12
- Page 127 and 128: NUCLEAR TECHNOLOGIES AND METHODS 13
- Page 129 and 130: NUCLEAR TECHNOLOGIES AND METHODS 13
- Page 131 and 132: NUCLEAR TECHNOLOGIES AND METHODS 13
- Page 133 and 134: NUCLEAR TECHNOLOGIES AND METHODS 13
- Page 135 and 136: NUCLEAR TECHNOLOGIES AND METHODS 13
- Page 137 and 138: NUCLEAR TECHNOLOGIES AND METHODS 14
- Page 139 and 140: THE INCT PUBLICATIONS IN 2005 143 T
- Page 141 and 142: THE INCT PUBLICATIONS IN 2005 145 2
- Page 143 and 144: THE INCT PUBLICATIONS IN 2005 147 5
- Page 145 and 146: THE INCT PUBLICATIONS IN 2005 149 8
- Page 147 and 148: THE INCT PUBLICATIONS IN 2005 CHAPT
- Page 149 and 150:
THE INCT PUBLICATIONS IN 2005 153 2
- Page 151 and 152:
THE INCT PUBLICATIONS IN 2005 155 1
- Page 153 and 154:
THE INCT PUBLICATIONS IN 2005 157 4
- Page 155 and 156:
THE INCT PUBLICATIONS IN 2005 159 6
- Page 157 and 158:
THE INCT PUBLICATIONS IN 2005 161 2
- Page 159 and 160:
THE INCT PUBLICATIONS IN 2005 163 V
- Page 161 and 162:
THE INCT PUBLICATIONS IN 2005 165 6
- Page 163 and 164:
THE INCT PUBLICATIONS IN 2005 167 9
- Page 165 and 166:
NUKLEONIKA 169 NUKLEONIKA THE INTER
- Page 167 and 168:
NUKLEONIKA 171 7. Influence of time
- Page 169 and 170:
INTERVIEWS IN 2005 173 INTERVIEWS I
- Page 171 and 172:
CONFERENCES ORGANIZED AND CO-ORGANI
- Page 173 and 174:
CONFERENCES ORGANIZED AND CO-ORGANI
- Page 175 and 176:
CONFERENCES ORGANIZED AND CO-ORGANI
- Page 177 and 178:
CONFERENCES ORGANIZED AND CO-ORGANI
- Page 179 and 180:
CONFERENCES ORGANIZED AND CO-ORGANI
- Page 181 and 182:
CONFERENCES ORGANIZED AND CO-ORGANI
- Page 183 and 184:
CONFERENCES ORGANIZED AND CO-ORGANI
- Page 185 and 186:
CONFERENCES ORGANIZED AND CO-ORGANI
- Page 187 and 188:
CONFERENCES ORGANIZED AND CO-ORGANI
- Page 189 and 190:
CONFERENCES ORGANIZED AND CO-ORGANI
- Page 191 and 192:
CONFERENCES ORGANIZED AND CO-ORGANI
- Page 193 and 194:
CONFERENCES ORGANIZED AND CO-ORGANI
- Page 195 and 196:
CONFERENCES ORGANIZED AND CO-ORGANI
- Page 197 and 198:
CONFERENCES ORGANIZED AND CO-ORGANI
- Page 199 and 200:
CONFERENCES ORGANIZED AND CO-ORGANI
- Page 201 and 202:
CONFERENCES ORGANIZED AND CO-ORGANI
- Page 203 and 204:
CONFERENCES ORGANIZED AND CO-ORGANI
- Page 205 and 206:
EDUCATION 209 EDUCATION Ph.D. PROGR
- Page 207 and 208:
RESEARCH PROJECTS AND CONTRACTS 211
- Page 209 and 210:
RESEARCH PROJECTS AND CONTRACTS IAE
- Page 211 and 212:
LIST OF VISITORS TO THE INCT IN 200
- Page 213 and 214:
LECTURES AND SEMINARS DELIVERED OUT
- Page 215 and 216:
LECTURES AND SEMINARS DELIVERED OUT
- Page 217 and 218:
AWARDS IN 2005 221 AWARDS IN 2005 1
- Page 219 and 220:
INSTRUMENTAL LABORATORIES AND TECHN
- Page 221 and 222:
INSTRUMENTAL LABORATORIES AND TECHN
- Page 223 and 224:
INSTRUMENTAL LABORATORIES AND TECHN
- Page 225 and 226:
INSTRUMENTAL LABORATORIES AND TECHN
- Page 227 and 228:
INSTRUMENTAL LABORATORIES AND TECHN
- Page 229 and 230:
INSTRUMENTAL LABORATORIES AND TECHN
- Page 231:
INDEX OF THE AUTHORS 235 Lisowska H