annual report annual report annual report annual report 2005
annual report annual report annual report annual report 2005
annual report annual report annual report annual report 2005

You also want an ePaper? Increase the reach of your titles
YUMPU automatically turns print PDFs into web optimized ePapers that Google loves.
136<br />
NUCLEONIC CONTROL SYSTEMS AND ACCELERATORS<br />
will produce non-zero values at lags other than zero<br />
to indicate a correlation between different lagged<br />
observation. Thanks to this feature of the autocorrelation<br />
function, drifts of the mean value in the<br />
removed noise v s<br />
as well as its periodicity can be<br />
more easily detected from the autocorrelogram<br />
than from the original data. As a measure of the<br />
random nature of the removed noise, the root<br />
mean square value of the correlation function<br />
rms(r vs ) was used:<br />
p<br />
1<br />
rms( r ) = ∑ () 2<br />
vs<br />
rvs<br />
i<br />
(4)<br />
p i=<br />
1<br />
The above considerations were checked on<br />
simulated spectra consisting of k channels and corrupted<br />
with Poisson distributed noise and then<br />
smoothed with the Savitsky-Golay procedure using<br />
second order polynomial and variable filter<br />
width dw [2]. As a measure of the smoothing quality,<br />
the ratio of the root mean square error (RMSE)<br />
of the total counts for the smoothed and raw spectra<br />
s(N s )/s(N) was applied [3]. The s * (N s )/s(N) ratio<br />
was computed using bootstrap method [4] for<br />
a single spectrum. The both ratios and rms(r vs<br />
) vs.<br />
filter width were plotted and are shown in Fig.1.<br />
It is seen that with increasing filter width, the<br />
quality of the smoothing also increases (RMSE<br />
ratio is lower), however, beginning from a certain<br />
channel, the rms(r vs ) also increases sharply indicating<br />
that in the removed noise some non-random<br />
component appear. If the goal of the optimization<br />
is to minimise distortion and maximise smoothing<br />
quality, the filter width should be chosen for the<br />
rms(r vs ) lying on the flat part of the plot and in<br />
“safe” distance left from the observed knee of the<br />
plot.<br />
References<br />
[1]. Vandegiste B. et al.: Handbook of chemometrics and<br />
qualimetrics. Part B. Elsevier, Amsterdam 1998, 711 p.<br />
[2]. PLS Toolbox 2.0 for use with MATLAB. Eigenvector<br />
1998, 320 p.<br />
[3]. Urbański P., Kowalska E.: Odszumianie widm promieniowania<br />
jonizującego. In: Technika jądrowa w przemyśle,<br />
medycynie, rolnictwie i ochronie środowiska. T.2.<br />
Instytut Chemii i Techniki Jądrowej, Warszawa 2002,<br />
pp.491-497. Raporty IChTJ, Seria A nr 2/2002 (in<br />
Polish).<br />
[4]. Hall P.: The bootstrap and Edgeworth expansion.<br />
Springer Verlag, New York 1992, 352 p.<br />
WIRELESS AIR MONITORING NETWORK<br />
WITH NEW AMIZ-2004G DUST MONITORS<br />
Adrian Jakowiuk, Bronisław Machaj, Jan P. Pieńkos, Edward Świstowski<br />
Since many years, MIZA and AMIZ dust monitors<br />
are used for the measurement of airborne dust<br />
concentration. The principle of operation of the<br />
monitor is based on determination of dust mass<br />
deposited on an air filter from a known volume of<br />
air sample. The dust mass is determined from radiation<br />
attenuation of a Pm-147 beta source. Additionally,<br />
relative humidity, atmospheric pressure<br />
and temperature of the air are measured [1].<br />
Usually, the dust monitors are installed in places<br />
where wire communication not always is secured.<br />
In such a case, direct collection of measuring results<br />
is impossible and requires that personnel of<br />
the environment protection units has to go frequently<br />
to the monitors to collect the measured<br />
data. In case the measurements are made in a few<br />
different places, such situation restricts the measurements<br />
from economical reasons.<br />
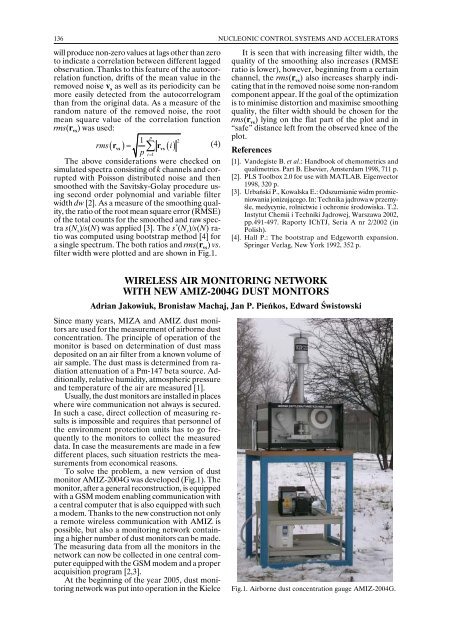
To solve the problem, a new version of dust<br />
monitor AMIZ-2004G was developed (Fig.1). The<br />
monitor, after a general reconstruction, is equipped<br />
with a GSM modem enabling communication with<br />
a central computer that is also equipped with such<br />
a modem. Thanks to the new construction not only<br />
a remote wireless communication with AMIZ is<br />
possible, but also a monitoring network containing<br />
a higher number of dust monitors can be made.<br />
The measuring data from all the monitors in the<br />
network can now be collected in one central computer<br />
equipped with the GSM modem and a proper<br />
acquisition program [2,3].<br />
At the beginning of the year <strong>2005</strong>, dust monitoring<br />
network was put into operation in the Kielce<br />
Fig.1. Airborne dust concentration gauge AMIZ-2004G.