- Page 1 and 2:
SEKE San Francisco Bay July 1-3 201
- Page 3 and 4:
Copyright © 2012 by Knowledge Syst
- Page 5 and 6:
The 24 th International Conference
- Page 7 and 8:
Zhenyu Chen, Nanjing University, Ch
- Page 9 and 10:
Riccardo Martoglia, University of M
- Page 11 and 12:
Poster/Demo Sessions Co-Chairs Fars
- Page 13 and 14:
Evaluating the Cost-Effectiveness o
- Page 15 and 16:
Program Understanding Evaluating Op
- Page 17 and 18:
An Empirical Study of Execution-Dat
- Page 19 and 20:
Computer Forensics: Toward the Cons
- Page 21 and 22:
Modeling Bridging KDM and ASTM for
- Page 23 and 24:
A Mapping Study on Software Product
- Page 25 and 26:
A proposal for the improvement of t
- Page 27 and 28:
Panel on Future Trends of Software
- Page 29 and 30:
een available for analysis. Social
- Page 31 and 32:
The rest of this paper is orga nize
- Page 33 and 34:
Now we assume is given, we first pr
- Page 35 and 36:
“iphone” and “blackberry” a
- Page 37 and 38:
nique estimate the impact set based
- Page 39 and 40:
Figure 1. An example to illustrate
- Page 41 and 42:
trategy, the results should support
- Page 43 and 44:
Figure 1. System Architecture would
- Page 45 and 46:
Figure 2. Sequence Diagram of Train
- Page 47 and 48:
deployed on Android phone and runs
- Page 49 and 50:
the ontology information is only us
- Page 51 and 52:
Both kinds of axioms lead to an inh
- Page 53 and 54:
engineer and achieving requirements
- Page 55 and 56:
elicitation and the act ivities con
- Page 57 and 58:
Step 2. Step 3. 1.2. Use of Procedu
- Page 59 and 60:
Figure 6.b. Task: Cognitive Analysi
- Page 61 and 62:
original User’s Discourse / Speec
- Page 63 and 64:
II. RELATED WORK Business processes
- Page 65 and 66:
test, we did not find any significa
- Page 67 and 68:
For the indicator “requirements a
- Page 69 and 70:
the model checkers SPIN [8] and NuS
- Page 71 and 72:
allow for the presentation of syste
- Page 73 and 74:
the requirement or design phases sh
- Page 75 and 76:
using the CR estimates against the
- Page 77 and 78:
Data Set TABLE II. DATA SETS Artifa
- Page 79 and 80:
Figure 4. Relative Error in the Est
- Page 81 and 82:
Take basic requirements from user a
- Page 83 and 84:
sent Semantic Web Ontologies. It co
- Page 85 and 86:
The rest of the paper is organized
- Page 87 and 88:
and the risk level. Existing assess
- Page 89 and 90:
diagram could give developers an in
- Page 91 and 92:
Figure 2. Co
- Page 93 and 94:
• Sensor(Lexical): at the top and
- Page 95 and 96:
An Overview of the RSLingo Approach
- Page 97 and 98:
Figure 2. Overview of the RSLingo a
- Page 99 and 100:
DETECTING EMERGENT BEHAVIOR IN DIST
- Page 101 and 102:
Definition 2: For a set of MSCs M,
- Page 103 and 104:
Stability of Filter-Based Feature S
- Page 105 and 106:
Algorithm 1: Threshold-Based Featur
- Page 107 and 108:
MI KS GM AUC PRC S2N RUS35 RUS50 RO
- Page 109 and 110:
80
- Page 111 and 112:
82
- Page 113 and 114:
84
- Page 115 and 116:
86
- Page 117 and 118:
Cloud Application Resource Mapping
- Page 119 and 120:
Fig. 1. UML Collaboration Diagram m
- Page 121 and 122:
Fig. 2. UML Activity Diagram modeli
- Page 123 and 124:
An Empirical Study of Software Metr
- Page 125 and 126:
TABLE I SOFTWARE DATASETS CHARACTER
- Page 127 and 128:
1) Classifiers: In this study, soft
- Page 129 and 130:
Progressive Clustering with Learned
- Page 131 and 132:
IV. DATA SOURCES We have been worki
- Page 133 and 134:
meta-data we assign to indicate sig
- Page 135 and 136:
Multi-Objective Optimization of Fuz
- Page 137 and 138:
uilding FNNs that satisfy different
- Page 139 and 140:
VI. EXPERIMENTAL RESULTS The presen
- Page 141 and 142:
Generating Performance Test Scripts
- Page 143 and 144:
test duration(s) for the scenario(s
- Page 145 and 146:
which are composed by the name and
- Page 147 and 148:
A Catalog of Patterns for Concept L
- Page 149 and 150:
assisted solution for lattice analy
- Page 151 and 152:
The complete lattice of the class s
- Page 153 and 154:
Client-Side Rendering Mechanism: A
- Page 155 and 156:
JavaScript code directly within the
- Page 157 and 158:
Fig. 6. CPU usage percentage of pre
- Page 159 and 160:
may introduce the extra learning cu
- Page 161 and 162:
[9] but no validation is provided i
- Page 163 and 164:
One of the st udents from Group B t
- Page 165 and 166:
scribed by the equation: where η i
- Page 167 and 168:
4 Model Checking DPN We use HyTech
- Page 169 and 170:
Recommender systems are usually cla
- Page 171 and 172:
such as one week and gradually dete
- Page 173 and 174:
•
- Page 175 and 176:
146
- Page 177 and 178:
Enforcing Contracts for Aspect-orie
- Page 179 and 180:
Table 1. Behavioral Rules in LSD [9
- Page 181 and 182:
1 public privileged aspect Update {
- Page 183 and 184:
Towards More Generic Aspect-Oriente
- Page 185 and 186:
vals must be denoted by some notion
- Page 187 and 188:
Aspect-Orientation in the Developme
- Page 189 and 190:
Table II SELECTED PRIMARY STUDIES #
- Page 191 and 192:
Evaluating Open Source Reverse Engi
- Page 193 and 194:
Table 1. Candidate reverse engineer
- Page 195 and 196:
Some tools may perform the needed f
- Page 197 and 198:
Coordination Model to Support Visua
- Page 199 and 200:
this CMV approach we employee three
- Page 201 and 202:
colored according to the Gradient T
- Page 203 and 204:
Improving Program Comprehension in
- Page 205 and 206:
The method used to support and eval
- Page 207 and 208:
1 2 3 4 5 6 7 8 9 10 11 12 13 14 15
- Page 209 and 210:
An Approach for Software Component
- Page 211 and 212:
properties. In particular, the foll
- Page 213 and 214:
Conference Dataset Anatomy Dataset
- Page 215 and 216:
equipment maintenance node may cont
- Page 217 and 218:
Online Anomaly Detection for Compon
- Page 219 and 220:
B. Monitoring Static Method Invocat
- Page 221 and 222:
undle which is responsible for pars
- Page 223 and 224:
An Exploratory Study of One-Use and
- Page 225 and 226:
Figure 1. Mindmap of Reuse Design P
- Page 227 and 228:
subject also caused outliers for re
- Page 229 and 230:
Choosing licenses in free open sour
- Page 231 and 232:
The important aspect is to provide
- Page 233 and 234:
that holds a model of each software
- Page 235 and 236:
Online Probability Application Char
- Page 237 and 238:
TABLE II THE PARAMETERS FOR THE HAR
- Page 239 and 240:
[10] N. Gunther, “Hit-and-run tac
- Page 241 and 242:
Section 5 d iscusses some related w
- Page 243 and 244:
model and the analysis results. The
- Page 245 and 246:
tree view of UML model, as show in
- Page 247 and 248:
II. BACKGROUND In this section, we
- Page 249 and 250:
Algorithm 2 MarkStatements function
- Page 251 and 252:
(a) printtok (b) printtok2 (c) sche
- Page 253 and 254:
Gupta extended HGS and proposed the
- Page 255 and 256:
manage intellectual knowledge with
- Page 257 and 258:
D. Manage Training When any trainin
- Page 259 and 260:
TABLE II. COMPARISON BETWEEN THE EX
- Page 261 and 262:
B. Trace Semantics of DAP Fig. 1. A
- Page 263 and 264:
∀ [DR ′ ] []gen [; ] [D]□ [;
- Page 265 and 266:
transformation idea in MDA [13] . T
- Page 267 and 268:
MappingRule MappingTGtoHP { [Rule I
- Page 269 and 270:
executing a continuous transition,
- Page 271 and 272:
protocol of DATS we used is properl
- Page 273 and 274:
in Boolean search and reasoning has
- Page 275 and 276:
to be broken by expelling one of it
- Page 277 and 278:
where, among other things: 1. The t
- Page 279 and 280:
A never-ending language learner cal
- Page 281 and 282:
4. i 2 Learning(DEC, mex) via Bias
- Page 283 and 284:
4.4. An Illustrative Example Now le
- Page 285 and 286:
Evolutionary Learning and Fuzzy Log
- Page 287 and 288:
In addition to the rules, the knowl
- Page 289 and 290:
As described in the previous sectio
- Page 291 and 292:
the ontology hierarchy; learning a
- Page 293 and 294:
three different learning techniques
- Page 295 and 296:
TABLE IX. USING SVM FOR LEARNING tr
- Page 297 and 298:
Siemens set contains seven C progra
- Page 299 and 300:
The program tcas is not included be
- Page 301 and 302:
esults. To be more specific, they w
- Page 303 and 304:
According to IEEE [10], regression
- Page 305 and 306:
(a) Volatility (b) Complexity (c) R
- Page 307 and 308:
It mimics the test engineer knowled
- Page 309 and 310:
integrate the test results. • Aut
- Page 311 and 312:
No tify the cloud controller to get
- Page 313 and 314:
of execution-data classification. T
- Page 315 and 316:
Figure 1. Boxplots of average AUC r
- Page 317 and 318:
anches is more applicable than the
- Page 319 and 320:
To validate the proposed approach,
- Page 321 and 322:
contains broadcast of Subject to Ob
- Page 323 and 324:
S 1a=1; S 2b=5; cobegin { S 3read
- Page 325 and 326:
.
- Page 327 and 328:
298
- Page 329 and 330:
A functionality is the ability of a
- Page 331 and 332:
level); in UML/J2EE technology [11]
- Page 333 and 334:
• to provide a unified catalogue
- Page 335 and 336:
flexibility they provide to model s
- Page 337 and 338:
complete in zero-time, and thus hav
- Page 339 and 340:
figure assumes the experiment with
- Page 341 and 342:
could be a practical way of dealing
- Page 343 and 344:
and (iv) the reduced amount of line
- Page 345 and 346:
III.BUSINESS RULES FRAMEWORK FOR KN
- Page 347 and 348:
explanation for why the program wan
- Page 349 and 350:
320
- Page 351 and 352:
322
- Page 353 and 354:
A model introducing SOAs quality at
- Page 355 and 356:
there exist a hierarchical ranking
- Page 357 and 358:
Software as a Service: Undo Hernán
- Page 359 and 360:
operations consist in reinjection i
- Page 361 and 362:
stored. If event failure, external
- Page 363 and 364:
ensure users the trustworthiness of
- Page 365 and 366:
Patient Doctor Doctor Patient Direc
- Page 367 and 368:
going down at a time. This is a rea
- Page 369 and 370:
Decidability of Minimal Supports of
- Page 371 and 372:
A S 1 1 1 0 0 0 1 1 0 0 0 1 1
- Page 373 and 374:
satisfies R( D) R( C) S 1. Compa
- Page 375 and 376:
Automated Generation of Concurrent
- Page 377 and 378:
target of testing. A blackbox test
- Page 379 and 380:
sequence. Each t i θ i in the firi
- Page 381 and 382:
SAMAT -AToolforSoftware Architectur
- Page 383 and 384:
Figure 4. The SAM Hierarchical Mode
- Page 385 and 386:
High-level Petri net Place Place Ty
- Page 387 and 388:
verification and thus is often limi
- Page 389 and 390:
(r 1 r 2 ...r k ) 1 denotes Path [r
- Page 391 and 392:
Fig. 3. Example a 3-compound weakly
- Page 393 and 394:
364
- Page 395 and 396:
366
- Page 397 and 398:
368
- Page 399 and 400:
necessary before verification. In t
- Page 401 and 402:
CTL formula as: AG (( jp EX( jp ad
- Page 403 and 404:
equirements level, like EA-Miner [1
- Page 405 and 406:
376
- Page 407 and 408:
378
- Page 409 and 410:
380
- Page 411 and 412:
II. RESOURCE-ORIENTED WORKFLOW MODE
- Page 413 and 414:
eventually triggers a co mmon task.
- Page 415 and 416:
Input: A resource oriented workflow
- Page 417 and 418:
access control exists, the action i
- Page 419 and 420:
(ACCDA), is customized to address a
- Page 421 and 422:
ICrudSchema and shown in Figure 3.
- Page 423 and 424:
Connectors for Secure Software Arch
- Page 425 and 426:
Non-repudiation security service pr
- Page 427 and 428:
anAsynchronousCustomer InterfaceCon
- Page 429 and 430:
How Social Network APIs Have Ended
- Page 431 and 432:
OSN Social Feed Unique Features Con
- Page 433 and 434:
users can control the reach of thei
- Page 435 and 436:
Computer Forensics: Toward the Cons
- Page 437 and 438: In 2009, Cohen et al. in [4] have o
- Page 439 and 440: dcterms:contributor, dcterms:creato
- Page 441 and 442: A Holistic Approach to Software Tra
- Page 443 and 444: Figure 1. Figure 1 shows an overvie
- Page 445 and 446: B. Case study in a proprietary proj
- Page 447 and 448: Pointcut Design with AODL Saqib iqb
- Page 449 and 450: system attributes, methods and exec
- Page 451 and 452: Feature modeling and Verification b
- Page 453 and 454: hasOptionalPart hasPart hasMandato
- Page 455 and 456: A Context Ontology Model for Pervas
- Page 457 and 458: Figure 1. UML view of the model. Th
- Page 459 and 460: Figure 3. Architecture for deliveri
- Page 461 and 462: Ontology-based Representation of Si
- Page 463 and 464: Figure 2. Upper Ontology fragment f
- Page 465 and 466: I2Sim simulation model was transfor
- Page 467 and 468: An ontology-based approach for stor
- Page 469 and 470: fying the equivalences between conc
- Page 471 and 472: • Homonymy conflicts: occur when
- Page 473 and 474: Automatic Generation of Architectur
- Page 475 and 476: we dealt w ith the verticals rules.
- Page 477 and 478: Towards Architectural Evolution thr
- Page 479 and 480: different from replacing it, we dec
- Page 481 and 482: Using FCA-based Change Impact Analy
- Page 483 and 484: Table 2. Impact set of C1,C2,C5 cha
- Page 485 and 486: Figure 3. The PF and PTS results fo
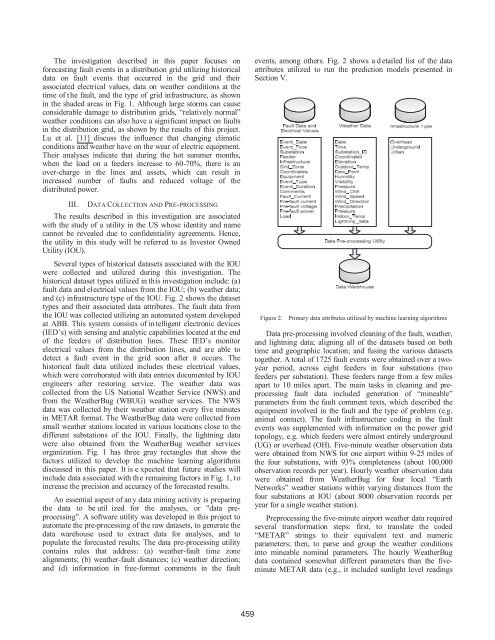
- Page 487: Forecasting Fault Events in Power D
- Page 491 and 492: classified. Recall is the probabili
- Page 493 and 494: Testing Interoperability Security P
- Page 495 and 496: Figure 2. Overview of the Test Gene
- Page 497 and 498: Objective Figure 4. Testing
- Page 499 and 500: A New Approach to Evaluate Path Fea
- Page 501 and 502: k v ( df i ) 0 , it means that the
- Page 503 and 504: Model & Method Feasibility Evaluati
- Page 505 and 506: Structural Testing for Multithreade
- Page 507 and 508: adequate to another criterion. This
- Page 509 and 510: 480
- Page 511 and 512: 482
- Page 513 and 514: 484
- Page 515 and 516: A Tiny Specification Metalanguage W
- Page 517 and 518: C. Syntax Extensions The expressive
- Page 519 and 520: however, does not allow variables f
- Page 521 and 522: derivation dependencies. The third
- Page 523 and 524: model extension as proposed in [6].
- Page 525 and 526: Figure 1. The process for engineeri
- Page 527 and 528: Figure 4. The abstractions extracte
- Page 529 and 530: way to detect something which could
- Page 531 and 532: Algorithm 1: Algorithm to recursive
- Page 533 and 534: obtain the input of experts on desi
- Page 535 and 536: A. Pattern Reuse In patterns reuse
- Page 537 and 538: IV. SCATTER In order to enhance pat
- Page 539 and 540:
These latter would be clustered acc
- Page 541 and 542:
described or even r etrieved, thus
- Page 543 and 544:
DC2AP Element and their Application
- Page 545 and 546:
21. Consequences Example of use DC2
- Page 547 and 548:
Legacy2Cloud logic. In this scope,
- Page 549 and 550:
2.3.1 Complementarity of MDD techno
- Page 551 and 552:
3.2.2 EAggregateRelationship The EA
- Page 553 and 554:
cess. The proposal follows the ADM
- Page 555 and 556:
II. OVERVIEW OF MODAL TRANSITION SY
- Page 557 and 558:
(1) V □ (A) ⊆ V □ (B), V ♦
- Page 559 and 560:
Suppose P = 〈S P , SP i , AI P ,
- Page 561 and 562:
Adaptive software should basically
- Page 563 and 564:
A. Step S1 - Define the Business Pr
- Page 565 and 566:
F. Step S6 - Monitor at Run-Time Th
- Page 567 and 568:
Figure 1, a metamodel defines an XM
- Page 569 and 570:
Figure 3 is a feature diagram that
- Page 571 and 572:
ecause the system of C-net model is
- Page 573 and 574:
Pub-T Tc Tc Sub-T Sub-T Figu
- Page 575 and 576:
Visual Studio Achievements, a Visua
- Page 577 and 578:
the project. This achievement has t
- Page 579 and 580:
proposed in this work requires the
- Page 581 and 582:
FTS is an important research area,
- Page 583 and 584:
C. Dependent Variables and Measures
- Page 585 and 586:
D. Conclusion Validity Conclusion v
- Page 587 and 588:
evaluation of team productivity, qu
- Page 589 and 590:
Figure 3: Process Fragment Example
- Page 591 and 592:
complexity issues traditionally inv
- Page 593 and 594:
Fig. 1: Swing Framework Class Diagr
- Page 595 and 596:
ize:Class”, with an empty precond
- Page 597 and 598:
Fig. 11: Overwritten Method Fig. 12
- Page 599 and 600:
Investigating the use of Bayesian n
- Page 601 and 602:
process for the network. Thus, this
- Page 603 and 604:
Reuse of Experiences Applied to Req
- Page 605 and 606:
Step 1: To start the process, the u
- Page 607 and 608:
Specification of Safety Critical Sy
- Page 609 and 610:
current belief of agents in order t
- Page 611 and 612:
Using the Results from a Systematic
- Page 613 and 614:
obtained from the categorization of
- Page 615 and 616:
that automatically presents the usa
- Page 617 and 618:
Improving a Web Usability Inspectio
- Page 619 and 620:
Following the experimental methodol
- Page 621 and 622:
About the category “Improvements
- Page 623 and 624:
Identification Guidelines for the D
- Page 625 and 626:
created according to the preview re
- Page 627 and 628:
In our analysis, the “Government
- Page 629 and 630:
In the following, we present the re
- Page 631 and 632:
USE SCENARIO The application Vuelos
- Page 633 and 634:
[8] Mayhew, D., “The Usability En
- Page 635 and 636:
Interaction State Set Structure Dat
- Page 637 and 638:
B. Component Model Fig. 2 show s th
- Page 639 and 640:
As a continuation of our research w
- Page 641 and 642:
PROMETHEE methods [3] belong to a f
- Page 643 and 644:
comparison rule, a value of 1/9 is
- Page 645 and 646:
TABLE V: Supermatrix for the exampl
- Page 647 and 648:
for knowledge sharing. Based on str
- Page 649 and 650:
y applying hash functions to its su
- Page 651 and 652:
Empirical Validation of Variability
- Page 653 and 654:
III. EXPERIMENTAL STUDY In this sec
- Page 655 and 656:
Table III SPEARMAN’S CORRELATION
- Page 657 and 658:
A Mapping Study on Software Product
- Page 659 and 660:
most relevant sources in software e
- Page 661 and 662:
TABLE IV TOOL’S CLASSIFICATION AC
- Page 663 and 664:
[2] P. Clements and L. Northrop, So
- Page 665 and 666:
and future works. II. BACKGROUND ON
- Page 667 and 668:
System Advanced Standard Module A M
- Page 669 and 670:
Algorithm 1: Backtracking for MIN-A
- Page 671 and 672:
outcomes from such research fields,
- Page 673 and 674:
TABLE IV. CONTINUED FROM PREVIOUS P
- Page 675 and 676:
contribution of each study was made
- Page 677 and 678:
assets, the plugin approach can be
- Page 679 and 680:
Figure 3: PlugSPL Feature Model Edi
- Page 681 and 682:
contributions from the several acto
- Page 683 and 684:
o Guideline 6.4: Softgoal dependenc
- Page 685 and 686:
descriptions must also b e configur
- Page 687 and 688:
It means that throughout the develo
- Page 689 and 690:
B. Instrumentation The experiment w
- Page 691 and 692:
• External Validity: W e have con
- Page 693 and 694:
II. THE PROPOSED TAXONOMY The taxon
- Page 695 and 696:
sub-dimension is categorized as, co
- Page 697 and 698:
A Proposal of Reference Architectur
- Page 699 and 700:
Figure. 1. Reference Architecture M
- Page 701 and 702:
A Variability Management Method for
- Page 703 and 704:
C. Correctness of configuration fil
- Page 705 and 706:
means patterns which are shown in s
- Page 707 and 708:
Tool Support for Anomaly Detection
- Page 709 and 710:
Figure 1. System overview of the SD
- Page 711 and 712:
Once the datasets were evaluated us
- Page 713 and 714:
Reconfiguration of Robot Applicatio
- Page 715 and 716:
data dependencies required for keep
- Page 717 and 718:
Spacemaker: Practical Formal Synthe
- Page 719 and 720:
Fig. 1. The ecommerce object model.
- Page 721 and 722:
Fig. 3. Mapping diagram for Figure
- Page 723 and 724:
A formal support for incremental be
- Page 725 and 726:
machine may be empty which should l
- Page 727 and 728:
software, based on revised requirem
- Page 729 and 730:
A Process-Based Approach to Improvi
- Page 731 and 732:
Appropriate processes m ust support
- Page 733 and 734:
Figure 2. Reordered layers of the k
- Page 735 and 736:
Automatic Acquisition of isA Relati
- Page 737 and 738:
III. VALIDATING THE DIMENSION HEADE
- Page 739 and 740:
The table title and the dimension s
- Page 741 and 742:
A light weight alternative for OLAP
- Page 743 and 744:
i.d. subsets of cubes focused on se
- Page 745 and 746:
Match production rules Enterprise S
- Page 747 and 748:
A Tool for Visualization of a Knowl
- Page 749 and 750:
other ontology visualization tools
- Page 751 and 752:
shown at Figure 5. Objectives are s
- Page 753 and 754:
Rendering UML Activity Diagrams as
- Page 755 and 756:
a = O1 → a → O2 b = O2 → b
- Page 757 and 758:
ecordProblem → A → reproducePro
- Page 759 and 760:
umlTUowl - A Both Generic and Vendo
- Page 761 and 762:
The tool’s ability to deal with S
- Page 763 and 764:
Elem. UML Example D 12 Harmonizing
- Page 765 and 766:
4) Associations: In the first test
- Page 767 and 768:
III. GRAPH REPRESENTATION OF CLASS
- Page 769 and 770:
as an add-in to popular UML m odeli
- Page 771 and 772:
742
- Page 773 and 774:
744
- Page 775 and 776:
746
- Page 777 and 778:
her necessities. However, the progr
- Page 779 and 780:
Figure 3. Global Log. of terms. The
- Page 781 and 782:
two stages. The first stage is focu
- Page 783 and 784:
754
- Page 785 and 786:
756
- Page 787 and 788:
758
- Page 789 and 790:
With the GDUC approach, we can mode
- Page 791 and 792:
Figure 6. Three proposals containin
- Page 793 and 794:
764
- Page 795 and 796:
766
- Page 797 and 798:
Proactive Two Way Mobile Advertisem
- Page 799 and 800:
information. If more than one adver
- Page 801 and 802:
Users can al so publish adv ertisem
- Page 803 and 804:
The COIN Platform: Supporting the M
- Page 805 and 806:
A-3
- Page 807 and 808:
Checking Contracts for AOP using XP
- Page 809 and 810:
Maicon B. da Silveira, 112 Aldo Dag
- Page 811 and 812:
Seyedehmehrnaz Mireslami, 70 Takao
- Page 813 and 814:
Wei Zhang, 422 Wenbo Zhang, 188 Zhi
- Page 815 and 816:
Desmond Greer Eric Gregoire Christi
- Page 817 and 818:
Poster/Demo Presenter’s Index A A