Exceptional Argentina Di Tella, Glaeser and Llach - Thomas Piketty
Exceptional Argentina Di Tella, Glaeser and Llach - Thomas Piketty
Exceptional Argentina Di Tella, Glaeser and Llach - Thomas Piketty

Create successful ePaper yourself
Turn your PDF publications into a flip-book with our unique Google optimized e-Paper software.
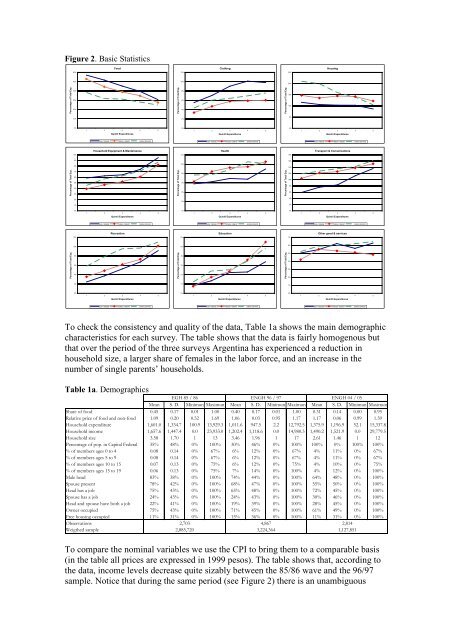
Figure 2. Basic Statistics<br />
Food<br />
Clothing<br />
Housing<br />
60%<br />
12%<br />
25%<br />
50%<br />
10%<br />
20%<br />
Percentage of Total Exp.<br />
40%<br />
30%<br />
20%<br />
Percentage of Total Exp.<br />
8%<br />
6%<br />
4%<br />
Percentage of Total Exp.<br />
15%<br />
10%<br />
10%<br />
2%<br />
5%<br />
0%<br />
1 2 3 4 5<br />
0%<br />
1 2 3 4 5<br />
0%<br />
1 2 3 4 5<br />
Quintil Expenditures<br />
Quintil Expenditures<br />
Quintil Expenditures<br />
EGH 1985/86 ENGH 1996/97 ENGH 2004/05<br />
EGH 1985/86 ENGH 1996/97 ENGH 2004/05<br />
EGH 1985/86 ENGH 1996/97 ENGH 2004/05<br />
Household Equipment & Manteinance<br />
Health<br />
Transport & Comunications<br />
10%<br />
12%<br />
18%<br />
9%<br />
16%<br />
8%<br />
10%<br />
14%<br />
Percentage of Total Exp.<br />
7%<br />
6%<br />
5%<br />
4%<br />
3%<br />
Percentage of Total Exp.<br />
8%<br />
6%<br />
4%<br />
Percentage of Total Exp.<br />
12%<br />
10%<br />
8%<br />
6%<br />
2%<br />
2%<br />
4%<br />
1%<br />
2%<br />
0%<br />
0%<br />
0%<br />
1 2 3 4 5<br />
1 2 3 4 5<br />
1 2 3 4 5<br />
Quintil Expenditures<br />
Quintil Expenditures<br />
Quintil Expenditures<br />
EGH 1985/86 ENGH 1996/97 ENGH 2004/05<br />
EGH 1985/86 ENGH 1996/97 ENGH 2004/05<br />
EGH 1985/86 ENGH 1996/97 ENGH 2004/05<br />
Recreation<br />
Education<br />
Other good & services<br />
12%<br />
6%<br />
7%<br />
10%<br />
5%<br />
6%<br />
Percentage of Total Exp.<br />
8%<br />
6%<br />
4%<br />
Percentage of Total Exp.<br />
4%<br />
3%<br />
2%<br />
Percentage of Total Exp.<br />
5%<br />
4%<br />
3%<br />
2%<br />
2%<br />
1%<br />
1%<br />
0%<br />
0%<br />
0%<br />
1 2 3 4 5<br />
1 2 3 4 5<br />
1 2 3 4 5<br />
Quintil Expenditures<br />
Quintil Expenditures<br />
Quintil Expenditures<br />
EGH 1985/86 ENGH 1996/97 ENGH 2004/05<br />
EGH 1985/86 ENGH 1996/97 ENGH 2004/05<br />
EGH 1985/86 ENGH 1996/97 ENGH 2004/05<br />
To check the consistency <strong>and</strong> quality of the data, Table 1a shows the main demographic<br />
characteristics for each survey. The table shows that the data is fairly homogenous but<br />
that over the period of the three surveys <strong>Argentina</strong> has experienced a reduction in<br />
household size, a larger share of females in the labor force, <strong>and</strong> an increase in the<br />
number of single parents’ households.<br />
Table 1a. Demographics<br />
EGH 85 / 86 ENGH 96 / 97 ENGH 04 / 05<br />
Mean S. D. Minimun Maximun Mean S. D. Minimun Maximun Mean S. D. Minimun Maximun<br />
Share of food 0.45 0.17 0.01 1.00 0.40 0.17 0.01 1.00 0.31 0.14 0.00 0.95<br />
Relative price of food <strong>and</strong> non-food 1.09 0.20 0.52 1.69 1.06 0.03 0.95 1.17 1.17 0.06 0.99 1.39<br />
Household expenditure 1,601.0 1,334.7 100.9 13,929.3 1,011.6 947.5 2.2 12,792.5 1,375.9 1,196.9 52.1 15,337.8<br />
Household income 1,657.6 1,447.4 0.0 23,933.0 1,202.4 1,118.6 0.0 14,980.3 1,490.2 1,521.9 0.0 29,779.5<br />
Household size 3.58 1.70 1 13 3.46 1.96 1 17 2.61 1.46 1 12<br />
Percentage of pop. in Capital Federal 35% 48% 0% 100% 30% 46% 0% 100% 100% 0% 100% 100%<br />
% of members ages 0 to 4 0.08 0.14 0% 67% 6% 12% 0% 67% 4% 11% 0% 67%<br />
% of members ages 5 to 9 0.08 0.14 0% 67% 6% 12% 0% 67% 4% 11% 0% 67%<br />
% of members ages 10 to 15 0.07 0.13 0% 75% 6% 12% 0% 75% 4% 10% 0% 75%<br />
% of members ages 15 to 19 0.06 0.13 0% 75% 7% 14% 0% 100% 4% 12% 0% 100%<br />
Male head 83% 38% 0% 100% 74% 44% 0% 100% 64% 48% 0% 100%<br />
Spouse present 78% 42% 0% 100% 68% 47% 0% 100% 55% 50% 0% 100%<br />
Head has a job 75% 43% 0% 100% 65% 48% 0% 100% 72% 45% 0% 100%<br />
Spouse has a job 24% 43% 0% 100% 24% 43% 0% 100% 30% 46% 0% 100%<br />
Head <strong>and</strong> spouse have both a job 22% 41% 0% 100% 19% 39% 0% 100% 28% 45% 0% 100%<br />
Owner occupied 75% 43% 0% 100% 71% 45% 0% 100% 61% 49% 0% 100%<br />
Free housing occupied 11% 31% 0% 100% 15% 36% 0% 100% 11% 31% 0% 100%<br />
Observations<br />
2,703<br />
4,867<br />
2,814<br />
Weigthed sample 2,885,720<br />
3,224,364<br />
1,127,851<br />
To compare the nominal variables we use the CPI to bring them to a comparable basis<br />
(in the table all prices are expressed in 1999 pesos). The table shows that, according to<br />
the data, income levels decrease quite sizably between the 85/86 wave <strong>and</strong> the 96/97<br />
sample. Notice that during the same period (see Figure 2) there is an unambiguous