Exceptional Argentina Di Tella, Glaeser and Llach - Thomas Piketty
Exceptional Argentina Di Tella, Glaeser and Llach - Thomas Piketty
Exceptional Argentina Di Tella, Glaeser and Llach - Thomas Piketty

You also want an ePaper? Increase the reach of your titles
YUMPU automatically turns print PDFs into web optimized ePapers that Google loves.
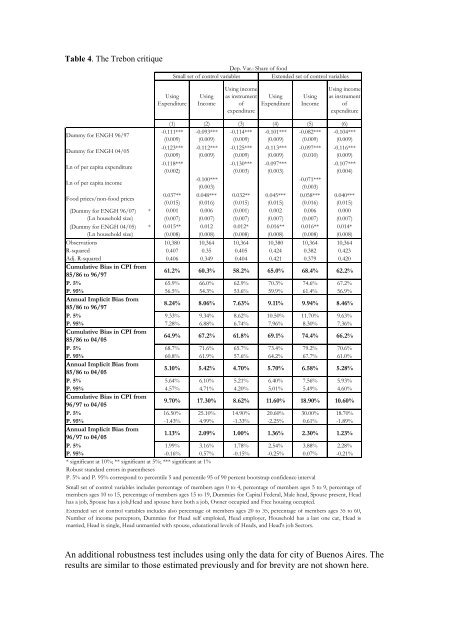
Table 4. The Trebon critique<br />
Dep. Var.: Share of food<br />
Small set of control variables<br />
Extended set of control variables<br />
Using<br />
Expenditure<br />
Using<br />
Income<br />
Using income<br />
as instrument<br />
of<br />
expenditure<br />
Using<br />
Expenditure<br />
Using<br />
Income<br />
Using income<br />
as instrument<br />
of<br />
expenditure<br />
Dummy for ENGH 96/97<br />
Dummy for ENGH 04/05<br />
Ln of per capita expenditure<br />
Ln of per capita income<br />
Food prices/non-food prices<br />
(Dummy for ENGH 96/07) *<br />
(Ln household size)<br />
(Dummy for ENGH 04/05) *<br />
(Ln household size)<br />
(1) (2) (3) (4) (5) (6)<br />
-0.111*** -0.093*** -0.114*** -0.101*** -0.082*** -0.104***<br />
(0.009) (0.009) (0.009) (0.009) (0.009) (0.009)<br />
-0.123*** -0.112*** -0.125*** -0.113*** -0.097*** -0.116***<br />
(0.009) (0.009) (0.009) (0.009) (0.010) (0.009)<br />
-0.118*** -0.130*** -0.097*** -0.107***<br />
(0.002) (0.003) (0.003) (0.004)<br />
-0.100*** -0.071***<br />
(0.003) (0.003)<br />
0.037** 0.048*** 0.032** 0.045*** 0.058*** 0.040***<br />
(0.015) (0.016) (0.015) (0.015) (0.016) (0.015)<br />
0.001 0.006 (0.001) 0.002 0.006 0.000<br />
(0.007) (0.007) (0.007) (0.007) (0.007) (0.007)<br />
0.015** 0.012 0.012* 0.016** 0.016** 0.014*<br />
(0.008) (0.008) (0.008) (0.008) (0.008) (0.008)<br />
Observations 10,380 10,364 10,364 10,380 10,364 10,364<br />
R-squared 0.407 0.35 0.405 0.424 0.382 0.423<br />
Adj. R-squared 0.406 0.349 0.404 0.421 0.379 0.420<br />
Cumulative Bias in CPI from<br />
85/86 to 96/97<br />
61.2% 60.3% 58.2% 65.0% 68.4% 62.2%<br />
P. 5% 65.9% 66.0% 62.9% 70.3% 74.6% 67.2%<br />
P. 95% 56.5% 54.3% 53.6% 59.9% 61.4% 56.9%<br />
Annual Implicit Bias from<br />
85/86 to 96/97<br />
8.24% 8.06% 7.63% 9.11% 9.94% 8.46%<br />
P. 5% 9.33% 9.34% 8.62% 10.50% 11.70% 9.63%<br />
P. 95% 7.28% 6.88% 6.74% 7.96% 8.30% 7.36%<br />
Cumulative Bias in CPI from<br />
85/86 to 04/05<br />
64.9% 67.2% 61.8% 69.1% 74.4% 66.2%<br />
P. 5% 68.7% 71.6% 65.7% 73.4% 79.2% 70.6%<br />
P. 95% 60.8% 61.9% 57.6% 64.2% 67.7% 61.0%<br />
Annual Implicit Bias from<br />
85/86 to 04/05<br />
5.10% 5.42% 4.70% 5.70% 6.58% 5.28%<br />
P. 5% 5.64% 6.10% 5.21% 6.40% 7.56% 5.93%<br />
P. 95% 4.57% 4.71% 4.20% 5.01% 5.49% 4.60%<br />
Cumulative Bias in CPI from<br />
96/97 to 04/05<br />
9.70% 17.30% 8.62% 11.60% 18.90% 10.60%<br />
P. 5% 16.50% 25.10% 14.90% 20.60% 30.00% 18.70%<br />
P. 95% -1.43% 4.99% -1.33% -2.25% 0.61% -1.89%<br />
Annual Implicit Bias from<br />
96/97 to 04/05<br />
1.13% 2.09% 1.00% 1.36% 2.30% 1.23%<br />
P. 5% 1.99% 3.16% 1.78% 2.54% 3.88% 2.28%<br />
P. 95% -0.16% 0.57% -0.15% -0.25% 0.07% -0.21%<br />
* significant at 10%; ** significant at 5%; *** significant at 1%<br />
Robust st<strong>and</strong>ard errors in parentheses<br />
P. 5% <strong>and</strong> P. 95% correspond to percentile 5 <strong>and</strong> percentile 95 of 90 percent bootstrap confidence interval<br />
Small set of control variables includes percentage of members ages 0 to 4, percentage of members ages 5 to 9, percentage of<br />
members ages 10 to 15, percentage of members ages 15 to 19, Dummies for Capital Federal, Male head, Spouse present, Head<br />
has a job, Spouse has a job,Head <strong>and</strong> spouse have both a job, Owner occupied <strong>and</strong> Free housing occupied.<br />
Extended set of control variables includes also percentage of members ages 20 to 35, percentage of members ages 35 to 60,<br />
Number of income perceptors, Dummies for Head self emploied, Head employer, Household has a last one car, Head is<br />
married, Head is single, Head unmarried with spouse, educational levels of Heads, <strong>and</strong> Head's job Sectors.<br />
An additional robustness test includes using only the data for city of Buenos Aires. The<br />
results are similar to those estimated previously <strong>and</strong> for brevity are not shown here.