Annual Performance Plan 2013/14 - Department of Education
Annual Performance Plan 2013/14 - Department of Education
Annual Performance Plan 2013/14 - Department of Education
Create successful ePaper yourself
Turn your PDF publications into a flip-book with our unique Google optimized e-Paper software.
Not available yet<br />
Not available yet<br />
Not available yet<br />
Target<br />
<strong>2013</strong>/<strong>14</strong><br />
<strong>Annual</strong> <strong>Performance</strong> <strong>Plan</strong> <strong>2013</strong>/<strong>14</strong><br />
Indicator<br />
number<br />
Indicator title Source <strong>of</strong> data Provincial<br />
<strong>Performance</strong> in 2012/13 5<br />
(or most recent)<br />
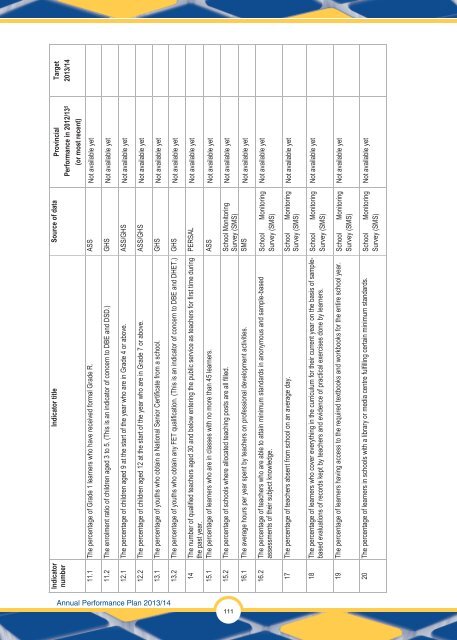
11.1 The percentage <strong>of</strong> Grade 1 learners who have received formal Grade R. ASS Not available yet<br />
11.2 The enrolment ratio <strong>of</strong> children aged 3 to 5. (This is an indicator <strong>of</strong> concern to DBE and DSD.) GHS Not available yet<br />
12.1 The percentage <strong>of</strong> children aged 9 at the start <strong>of</strong> the year who are in Grade 4 or above. ASS/GHS Not available yet<br />
12.2 The percentage <strong>of</strong> children aged 12 at the start <strong>of</strong> the year who are in Grade 7 or above. ASS/GHS Not available yet<br />
13.1 The percentage <strong>of</strong> youths who obtain a National Senior Certificate from a school. GHS Not available yet<br />
13.2 The percentage <strong>of</strong> youths who obtain any FET qualification. (This is an indicator <strong>of</strong> concern to DBE and DHET.) GHS Not available yet<br />
<strong>14</strong> The number <strong>of</strong> qualified teachers aged 30 and below entering the public service as teachers for first time during PERSAL Not available yet<br />
the past year.<br />
15.1 The percentage <strong>of</strong> learners who are in classes with no more than 45 learners. ASS Not available yet<br />
111<br />
15.2 The percentage <strong>of</strong> schools where allocated teaching posts are all filled. School Monitoring Not available yet<br />
Survey (SMS)<br />
16.1 The average hours per year spent by teachers on pr<strong>of</strong>essional development activities. SMS Not available yet<br />
16.2 The percentage <strong>of</strong> teachers who are able to attain minimum standards in anonymous and sample-based<br />
assessments <strong>of</strong> their subject knowledge.<br />
School Monitoring<br />
Survey (SMS)<br />
Not available yet<br />
17 The percentage <strong>of</strong> teachers absent from school on an average day. School Monitoring<br />
Survey (SMS)<br />
Not available yet<br />
18 The percentage <strong>of</strong> learners who cover everything in the curriculum for their current year on the basis <strong>of</strong> samplebased<br />
evaluations <strong>of</strong> records kept by teachers and evidence <strong>of</strong> practical exercises done by learners.<br />
School Monitoring<br />
Survey (SMS)<br />
19 The percentage <strong>of</strong> learners having access to the required textbooks and workbooks for the entire school year. School Monitoring<br />
Survey (SMS)<br />
20 The percentage <strong>of</strong> learners in schools with a library or media centre fulfilling certain minimum standards. School Monitoring<br />
Survey (SMS)


