

Annual Performance Plan 2013/14 - Department of Education
Annual Performance Plan 2013/14 - Department of Education
Annual Performance Plan 2013/14 - Department of Education

Create successful ePaper yourself
Turn your PDF publications into a flip-book with our unique Google optimized e-Paper software.
20<strong>14</strong>/15<br />
Estimated<br />
2015/16<br />
Estimated<br />
<strong>Annual</strong> <strong>Performance</strong> <strong>Plan</strong> <strong>2013</strong>/<strong>14</strong><br />
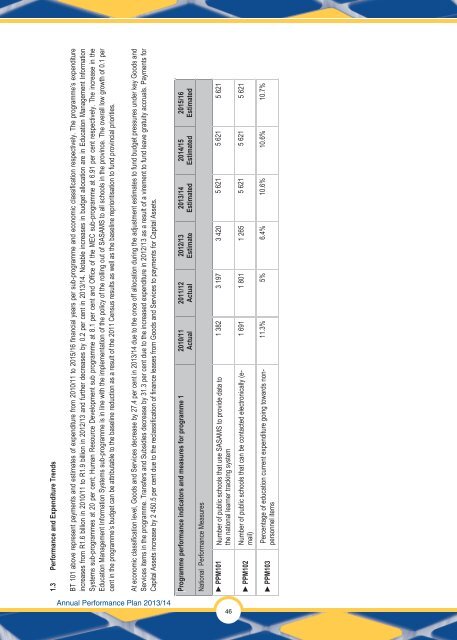
1.3 <strong>Performance</strong> and Expenditure Trends<br />
BT 101 above represent payments and estimates <strong>of</strong> expenditure from 2010/11 to 2015/16 financial years per sub-programme and economic classification respectively. The programme’s expenditure<br />
increases from R1.6 billion in 2010/11 to R1.9 billion in 2012/13 and further decreases by 0.2 per cent in <strong>2013</strong>/<strong>14</strong>. Notable increases in budget allocation are in <strong>Education</strong> Management Information<br />
Systems sub-programmes at 20 per cent; Human Resource Development sub programme at 8.1 per cent and Office <strong>of</strong> the MEC sub-programme at 6.91 per cent respectively. The increase in the<br />
<strong>Education</strong> Management Information Systems sub-programme is in line with the implementation <strong>of</strong> the policy <strong>of</strong> the rolling out <strong>of</strong> SASAMS to all schools in the province. The overall low growth <strong>of</strong> 0.1 per<br />
cent in the programme’s budget can be attributable to the baseline reduction as a result <strong>of</strong> the 2011 Census results as well as the baseline reprioritisation to fund provincial priorities.<br />
At economic classification level, Goods and Services decrease by 27.4 per cent in <strong>2013</strong>/<strong>14</strong> due to the once <strong>of</strong>f allocation during the adjustment estimates to fund budget pressures under key Goods and<br />
Services items in the programme. Transfers and Subsidies decrease by 31.3 per cent due to the increased expenditure in 2012/13 as a result <strong>of</strong> a virement to fund leave gratuity accruals. Payments for<br />
Capital Assets increase by 2 450.5 per cent due to the reclassification <strong>of</strong> finance leases from Goods and Services to payments for Capital Assets.<br />
Programme performance indicators and measures for programme 1 2010/11<br />
Actual<br />
National <strong>Performance</strong> Measures<br />
2011/12<br />
Actual<br />
2012/13<br />
Estimate<br />
<strong>2013</strong>/<strong>14</strong><br />
Estimated<br />
46<br />
►PPM101 Number <strong>of</strong> public schools that use SASAMS to provide data to<br />
the national learner tracking system<br />
►PPM102<br />
►PPM103<br />
Number <strong>of</strong> public schools that can be contacted electronically (email)<br />
Percentage <strong>of</strong> education current expenditure going towards nonpersonnel<br />
items<br />
1 382 3 197 3 420 5 621 5 621 5 621<br />
1 691 1 801 1 265 5 621 5 621 5 621<br />
11.3% 5% 6.4% 10.6% 10.6% 10.7%


