

Annual Performance Plan 2013/14 - Department of Education
Annual Performance Plan 2013/14 - Department of Education
Annual Performance Plan 2013/14 - Department of Education

Create successful ePaper yourself
Turn your PDF publications into a flip-book with our unique Google optimized e-Paper software.
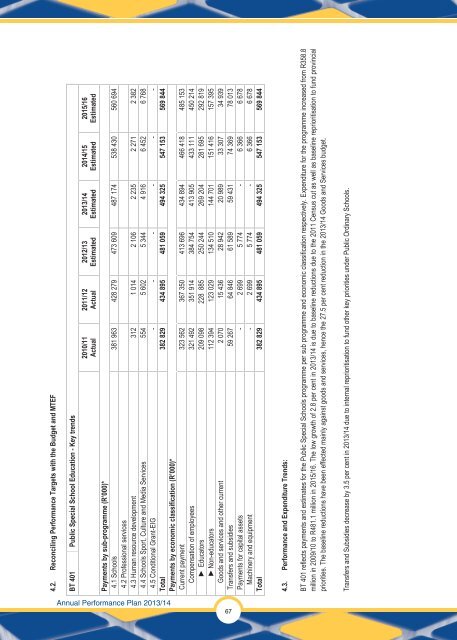
BT 401 reflects payments and estimates for the Public Special Schools programme per sub programme and economic classification respectively. Expenditure for the programme increased from R358.8<br />
million in 2009/10 to R481.1 million in 2015/16. The low growth <strong>of</strong> 2.8 per cent in <strong>2013</strong>/<strong>14</strong> is due to baseline reductions due to the 2011 Census cut as well as baseline reprioritisation to fund provincial<br />
priorities. The baseline reductions have been effected mainly against goods and services, hence the 27.5 per cent reduction in the <strong>2013</strong>/<strong>14</strong> Goods and Services budget.<br />
<strong>Annual</strong> <strong>Performance</strong> <strong>Plan</strong> <strong>2013</strong>/<strong>14</strong><br />
67<br />
4.2. Reconciling <strong>Performance</strong> Targets with the Budget and MTEF<br />
BT 401 Public Special School <strong>Education</strong> - Key trends<br />
2010/11<br />
Actual<br />
2011/12<br />
Actual<br />
2012/13<br />
Estimated<br />
<strong>2013</strong>/<strong>14</strong><br />
Estimated<br />
20<strong>14</strong>/15<br />
Estimated<br />
2015/16<br />
Estimated<br />
Payments by sub-programme (R’000)*<br />
4.1 Schools 381 963 428 279 473 609 487 174 538 430 560 694<br />
4.2 Pr<strong>of</strong>essional services<br />
4.3 Human resource development 312 1 0<strong>14</strong> 2 106 2 235 2 271 2 382<br />
4.4 Schools Sport, Culture and Media Services 554 5 602 5 344 4 916 6 452 6 768<br />
4.5 Conditional Grant-EIG - - - - - -<br />
Total 382 829 434 895 481 059 494 325 547 153 569 844<br />
Payments by economic classification (R’000)*<br />
Current payment 323 562 367 350 413 696 434 894 466 418 485 153<br />
Compensation <strong>of</strong> employees 321 492 351 9<strong>14</strong> 384 754 413 905 433 111 450 2<strong>14</strong><br />
► Educators 209 098 228 885 250 244 269 204 281 695 292 819<br />
►Non-educators 112 394 123 029 134 510 <strong>14</strong>4 701 151 416 157 395<br />
Goods and services and other current 2 070 15 436 28 942 20 989 33 307 34 939<br />
Transfers and subsidies 59 267 64 846 61 589 59 431 74 369 78 013<br />
Payments for capital assets - 2 699 5 774 - 6 366 6 678<br />
Machinery and equipment - 2 699 5 774 - 6 366 6 678<br />
Total 382 829 434 895 481 059 494 325 547 153 569 844<br />
4.3. <strong>Performance</strong> and Expenditure Trends:<br />
Transfers and Subsidies decrease by 3.5 per cent in <strong>2013</strong>/<strong>14</strong> due to internal reprioritisation to fund other key priorities under Public Ordinary Schools.


