

Annual Performance Plan 2013/14 - Department of Education
Annual Performance Plan 2013/14 - Department of Education
Annual Performance Plan 2013/14 - Department of Education

You also want an ePaper? Increase the reach of your titles
YUMPU automatically turns print PDFs into web optimized ePapers that Google loves.
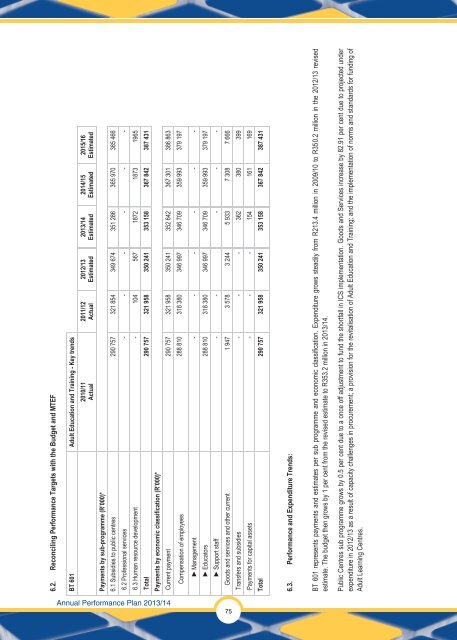
BT 601 represents payments and estimates per sub programme and economic classification. Expenditure grows steadily from R213.4 million in 2009/10 to R350.2 million in the 2012/13 revised<br />
estimate. The budget then grows by 1 per cent from the revised estimate to R353.2 million in <strong>2013</strong>/<strong>14</strong>.<br />
Public Centres sub programme grows by 0.5 per cent due to a once <strong>of</strong>f adjustment to fund the shortfall in ICS implementation. Goods and Services increase by 82.91 per cent due to projected under<br />
expenditure in 2012/13 as a result <strong>of</strong> capacity challenges in procurement; a provision for the revitalisation <strong>of</strong> Adult <strong>Education</strong> and Training; and the implementation <strong>of</strong> norms and standards for funding <strong>of</strong><br />
Adult Learning Centres.<br />
<strong>Annual</strong> <strong>Performance</strong> <strong>Plan</strong> <strong>2013</strong>/<strong>14</strong><br />
75<br />
6.2. Reconciling <strong>Performance</strong> Targets with the Budget and MTEF<br />
BT 601 Adult <strong>Education</strong> and Training - Key trends<br />
Payments by sub-programme (R’000)*<br />
2010/11<br />
Actual<br />
2011/12<br />
Actual<br />
2012/13<br />
Estimated<br />
<strong>2013</strong>/<strong>14</strong><br />
Estimated<br />
20<strong>14</strong>/15<br />
Estimated<br />
2015/16<br />
Estimated<br />
6.1 Subsidies to public centres 290 757 321 854 349 674 351 286 365 970 385 466<br />
6.2 Pr<strong>of</strong>essional services - - - - - -<br />
6.3 Human resource development - 104 567 1872 1873 1965<br />
Total 290 757 321 958 350 241 353 158 367 842 387 431<br />
Payments by economic classification (R’000)*<br />
Current payment 290 757 321 958 350 241 352 642 367 301 386 863<br />
Compensation <strong>of</strong> employees 288 810 318 380 346 997 346 709 359 993 379 197<br />
►Management - - - - - -<br />
►Educators 288 810 318 380 346 997 346 709 359 993 379 197<br />
►Support staff - - - - -<br />
Goods and services and other current 1 947 3 578 3 244 5 933 7 308 7 666<br />
Transfers and subsidies - - - 362 380 399<br />
Payments for capital assets - - - 154 161 169<br />
Total 290 757 321 958 350 241 353 158 367 842 387 431<br />
6.3. <strong>Performance</strong> and Expenditure Trends:


