

Annual Performance Plan 2013/14 - Department of Education
Annual Performance Plan 2013/14 - Department of Education
Annual Performance Plan 2013/14 - Department of Education

Create successful ePaper yourself
Turn your PDF publications into a flip-book with our unique Google optimized e-Paper software.
Current payment 204 642 222 040 272 225 293 218 294 023 306 998<br />
Total 233 474 253 304 326 329 343 341 348 834 364 495<br />
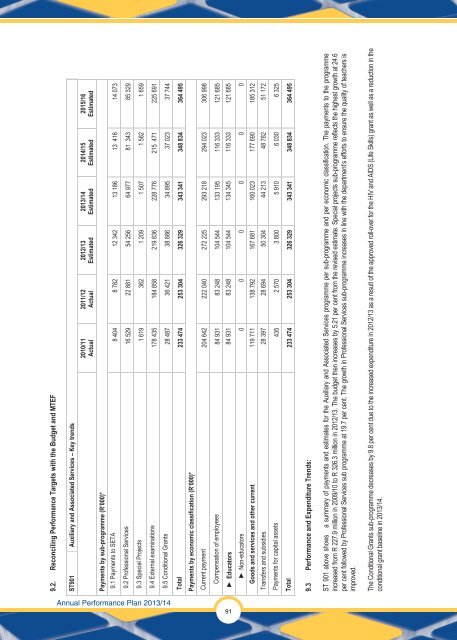
ST 901 above shows a summary <strong>of</strong> payments and estimates for the Auxiliary and Associated Services programme per sub-programme and per economic classification. The payments to the programme<br />
increased from R 227.9 million in 2009/10 to R 326.3 million in 2012/13. The budget then increases by 5.21 per cent from the revised estimate. Special projects sub-programme reflects the highest growth at 24.6<br />
per cent followed by Pr<strong>of</strong>essional Services sub programme at 19.7 per cent. The growth in Pr<strong>of</strong>essional Services sub-programme increases in line with the department’s efforts to ensure the quality <strong>of</strong> teachers is<br />
improved.<br />
The Conditional Grants sub-programme decreases by 9.8 per cent due to the increased expenditure in 2012/13 as a result <strong>of</strong> the approved roll-over for the HIV and AIDS (Life Skills) grant as well as a reduction in the<br />
conditional grant baseline in <strong>2013</strong>/<strong>14</strong>.<br />
<strong>Annual</strong> <strong>Performance</strong> <strong>Plan</strong> <strong>2013</strong>/<strong>14</strong><br />
9.2. Reconciling <strong>Performance</strong> Targets with the Budget and MTEF<br />
ST901 Auxiliary and Associated Services – Key trends<br />
2010/11<br />
Actual<br />
2011/12<br />
Actual<br />
2012/13<br />
Estimated<br />
<strong>2013</strong>/<strong>14</strong><br />
Estimated<br />
20<strong>14</strong>/15<br />
Estimated<br />
2015/16<br />
Estimated<br />
Payments by sub-programme (R’000)*<br />
9.1 Payments to SETA 8 404 8 782 12 342 13 186 13 416 <strong>14</strong> 073<br />
9.2 Pr<strong>of</strong>essional Services 16 529 22 881 54 256 64 977 81 343 85 329<br />
9.3 Special Projects 1 619 362 1 209 1 507 1 582 1 659<br />
9.4 External examinations 178 435 184 858 219 836 228 776 215 471 225 691<br />
9.5 Conditional Grants 28 487 36 421 38 686 34 895 37 023 37 744<br />
Total 233 474 253 304 326 329 343 341 348 834 364 495<br />
Payments by economic classification (R’000)*<br />
91<br />
Compensation <strong>of</strong> employees 84 931 83 248 104 544 133 195 116 333 121 685<br />
► Educators 84 931 83 248 104 544 134 345 116 333 121 685<br />
► Non-educators 0 0 0 0 0 0<br />
Goods and services and other current 119 711 138 792 167 681 160 023 177 690 185 312<br />
Transfers and subsidies 28 397 28 694 50 304 44 213 48 782 51 172<br />
Payments for capital assets 435 2 570 3 800 5 910 6 030 6 325<br />
9.3 <strong>Performance</strong> and Expenditure Trends:


