

Annual Performance Plan 2013/14 - Department of Education
Annual Performance Plan 2013/14 - Department of Education
Annual Performance Plan 2013/14 - Department of Education

Create successful ePaper yourself
Turn your PDF publications into a flip-book with our unique Google optimized e-Paper software.
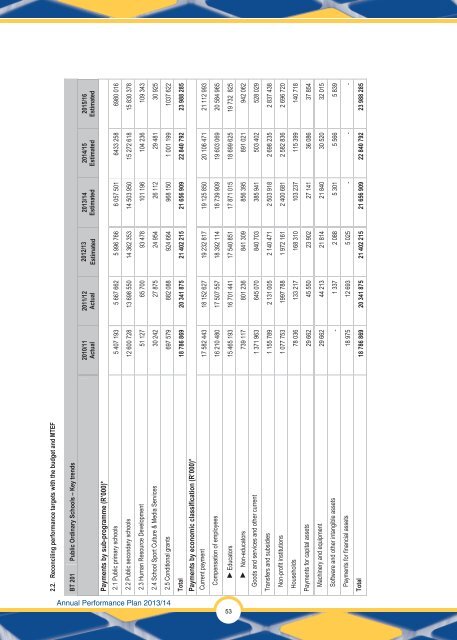
Current payment 17 582 443 18 152 627 19 232 817 19 125 850 20 106 471 21 112 993<br />
Compensation <strong>of</strong> employees 16 210 480 17 507 557 18 392 1<strong>14</strong> 18 739 909 19 603 069 20 584 965<br />
► Non-educators 739 117 801 236 841 309 856 395 891 021 942 062<br />
Goods and services and other current 1 371 963 645 070 840 703 385 941 503 402 528 029<br />
Transfers and subsidies 1 155 789 2 131 005 2 <strong>14</strong>0 471 2 503 918 2 698 235 2 837 438<br />
Non-pr<strong>of</strong>it institutions 1 077 753 1997 788 1 972 161 2 400 681 2 582 836 2 696 720<br />
Households 78 036 133 217 168 310 103 237 115 399 <strong>14</strong>0 718<br />
Payments for capital assets 29 662 45 550 23 902 27 <strong>14</strong>1 36 086 37 854<br />
Machinery and equipment 29 662 44 213 21 8<strong>14</strong> 21 840 30 520 32 015<br />
S<strong>of</strong>tware and other intangible assets - 1 337 2 088 5 301 5 566 5 839<br />
Payments for financial assets 18 975 12 693 5 025 - - -<br />
Total 18 786 869 20 341 875 21 402 215 21 656 909 22 840 792 23 988 285<br />
<strong>Annual</strong> <strong>Performance</strong> <strong>Plan</strong> <strong>2013</strong>/<strong>14</strong><br />
2.2. Reconciling performance targets with the budget and MTEF<br />
BT 201 Public Ordinary Schools – Key trends<br />
Payments by sub-programme (R’000)*<br />
2010/11<br />
Actual<br />
2011/12<br />
Actual<br />
2012/13<br />
Estimated<br />
<strong>2013</strong>/<strong>14</strong><br />
Estimated<br />
20<strong>14</strong>/15<br />
Estimated<br />
2015/16<br />
Estimated<br />
2.1 Public primary schools 5 407 193 5 667 662 5 996 766 6 057 501 6433 258 6980 016<br />
2.2 Public secondary schools 12 600 728 13 698 550 <strong>14</strong> 362 353 <strong>14</strong> 503 950 15 272 618 15 830 378<br />
2.3 Human Resource Development 51 127 65 700 93 478 101 196 104 236 109 343<br />
2.4 School Sport Culture & Media Services 30 242 27 875 24 954 26 112 29 481 30 925<br />
2.5 Conditional grants 697 579 882 088 924 664 968 150 1 001 199 1037 622<br />
Total 18 786 869 20 341 875 21 402 215 21 656 909 22 840 792 23 988 285<br />
Payments by economic classification (R’000)*<br />
53<br />
►Educators 15 465 193 16 701 441 17 540 851 17 871 015 18 699 625 19 732 825


