

Annual Performance Plan 2013/14 - Department of Education
Annual Performance Plan 2013/14 - Department of Education
Annual Performance Plan 2013/14 - Department of Education

Create successful ePaper yourself
Turn your PDF publications into a flip-book with our unique Google optimized e-Paper software.
CAPITAL INVESTMENT, MAINTENANCE AND ASSET MANAGEMENT PLAN<br />
Capital Investment<br />
The Eastern Cape <strong>Department</strong> <strong>of</strong> <strong>Education</strong> has an infrastructure stock which comprises 6502 schools (including ECD centres but<br />
excluding independent schools). These schools, many <strong>of</strong> which are old mud structure buildings, provide teaching spaces for just<br />
over 1,95 million learners in the Province.<br />
Over the past twelve years, the <strong>Department</strong> has made significant inroads into eradicating backlogs and improving physical conditions<br />
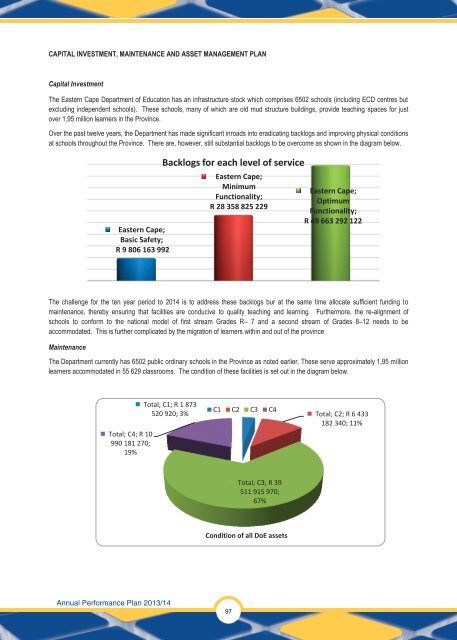
at schools throughout the Province. There are, however, still substantial backlogs to be overcome as shown in the diagram below.<br />
Eastern Cape;<br />
Basic Safety;<br />
R 9 806 163 992<br />
Backlogs for each level <strong>of</strong> service<br />
Eastern Cape;<br />
Minimum<br />
Functionality;<br />
R 28 358 825 229<br />
Eastern Cape;<br />
Optimum<br />
Functionality;<br />
R 49 663 292 122<br />
The challenge for the ten year period to 20<strong>14</strong> is to address these backlogs bur at the same time allocate sufficient funding to<br />
maintenance, thereby ensuring that facilities are conducive to quality teaching and learning. Furthermore, the re-alignment <strong>of</strong><br />
schools to conform to the national model <strong>of</strong> first stream Grades R– 7 and a second stream <strong>of</strong> Grades 8–12 needs to be<br />
accommodated. This is further complicated by the migration <strong>of</strong> learners within and out <strong>of</strong> the province<br />
Maintenance<br />
The <strong>Department</strong> currently has 6502 public ordinary schools in the Province as noted earlier. These serve approximately 1,95 million<br />
learners accommodated in 55 629 classrooms. The condition <strong>of</strong> these facilities is set out in the diagram below.<br />
Total; C1; R 1 873<br />
C1 C2 C3 C4<br />
520 920; 3% Total; C2; R 6 433<br />
182 340; 11%<br />
Total; C4; R 10<br />
990 181 270;<br />
19%<br />
Total; C3; R 39<br />
511 915 970;<br />
67%<br />
Condition <strong>of</strong> all DoE assets<br />
<strong>Annual</strong> <strong>Performance</strong> <strong>Plan</strong> <strong>2013</strong>/<strong>14</strong><br />
97


