

Annual Performance Plan 2013/14 - Department of Education
Annual Performance Plan 2013/14 - Department of Education
Annual Performance Plan 2013/14 - Department of Education

Create successful ePaper yourself
Turn your PDF publications into a flip-book with our unique Google optimized e-Paper software.
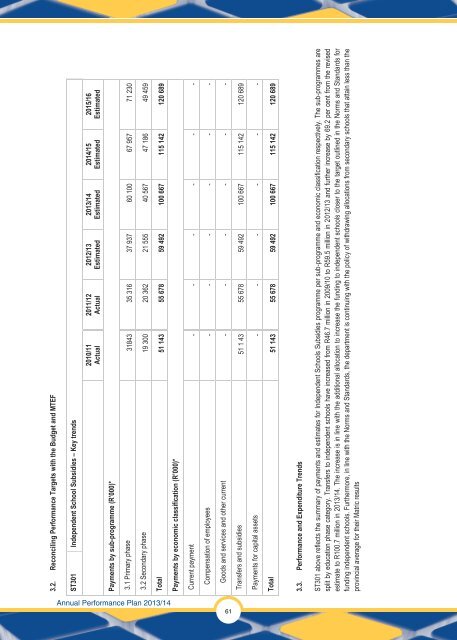
Current payment - - - - - -<br />
Compensation <strong>of</strong> employees - - - - - -<br />
Payments for capital assets - - - - - -<br />
Total 51 <strong>14</strong>3 55 678 59 492 100 667 115 <strong>14</strong>2 120 689<br />
ST301 above reflects the summary <strong>of</strong> payments and estimates for Independent Schools Subsidies programme per sub-programme and economic classification respectively. The sub-programmes are<br />
split by education phase category. Transfers to independent schools have increased from R46.7 million in 2009/10 to R59.5 million in 2012/13 and further increase by 69.2 per cent from the revised<br />
estimate to R100.7 million in <strong>2013</strong>/<strong>14</strong>. The increase is in line with the additional allocation to increase the funding to independent schools closer to the target outlined in the Norms and Standards for<br />
funding independent schools. Furthermore, in line with the Norms and Standards, the department is continuing with the policy <strong>of</strong> withdrawing allocations from secondary schools that attain less than the<br />
provincial average for their Matric results<br />
<strong>Annual</strong> <strong>Performance</strong> <strong>Plan</strong> <strong>2013</strong>/<strong>14</strong><br />
3.2. Reconciling <strong>Performance</strong> Targets with the Budget and MTEF<br />
ST301 Independent School Subsidies – Key trends<br />
Payments by sub-programme (R’000)*<br />
2010/11<br />
Actual<br />
2011/12<br />
Actual<br />
2012/13<br />
Estimated<br />
<strong>2013</strong>/<strong>14</strong><br />
Estimated<br />
20<strong>14</strong>/15<br />
Estimated<br />
2015/16<br />
Estimated<br />
3.1 Primary phase 31843 35 316 37 937 60 100 67 957 71 230<br />
3.2 Secondary phase 19 300 20 362 21 555 40 567 47 186 49 459<br />
Total 51 <strong>14</strong>3 55 678 59 492 100 667 115 <strong>14</strong>2 120 689<br />
Payments by economic classification (R’000)*<br />
61<br />
Goods and services and other current - - - - - -<br />
Transfers and subsidies 51 1 43 55 678 59 492 100 667 115 <strong>14</strong>2 120 689<br />
3.3. <strong>Performance</strong> and Expenditure Trends


