

Annual Performance Plan 2013/14 - Department of Education
Annual Performance Plan 2013/14 - Department of Education
Annual Performance Plan 2013/14 - Department of Education

You also want an ePaper? Increase the reach of your titles
YUMPU automatically turns print PDFs into web optimized ePapers that Google loves.
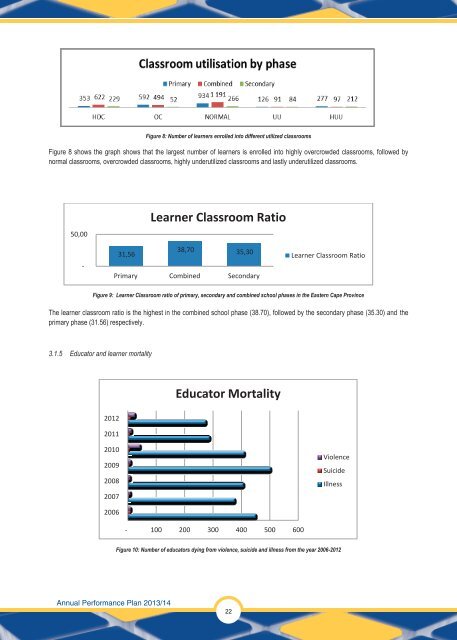
Figure 8: Number <strong>of</strong> learners enrolled into different utilized classrooms<br />
Figure 8 shows the graph shows that the largest number <strong>of</strong> learners is enrolled into highly overcrowded classrooms, followed by<br />
normal classrooms, overcrowded classrooms, highly underutilized classrooms and lastly underutilized classrooms.<br />
50,00<br />
-<br />
Learner Classroom Ratio<br />
31,56<br />
38,70 35,30<br />
Primary Combined Secondary<br />
Learner Classroom Ratio<br />
Figure 9: Learner Classroom ratio <strong>of</strong> primary, secondary and combined school phases in the Eastern Cape Province<br />
The learner classroom ratio is the highest in the combined school phase (38.70), followed by the secondary phase (35.30) and the<br />
primary phase (31.56) respectively.<br />
3.1.5 Educator and learner mortality<br />
Educator Mortality<br />
2012<br />
2011<br />
2010<br />
2009<br />
2008<br />
2007<br />
Violence<br />
Suicide<br />
Illness<br />
2006<br />
- 100 200 300 400 500 600<br />
Figure 10: Number <strong>of</strong> educators dying from violence, suicide and illness from the year 2006-2012<br />
<strong>Annual</strong> <strong>Performance</strong> <strong>Plan</strong> <strong>2013</strong>/<strong>14</strong><br />
22


