Segmentation of 3D Tubular Tree Structures in Medical Images ...
Segmentation of 3D Tubular Tree Structures in Medical Images ...
Segmentation of 3D Tubular Tree Structures in Medical Images ...

Create successful ePaper yourself
Turn your PDF publications into a flip-book with our unique Google optimized e-Paper software.
88 Chapter 5. Liver Vascular <strong>Tree</strong> <strong>Segmentation</strong><br />
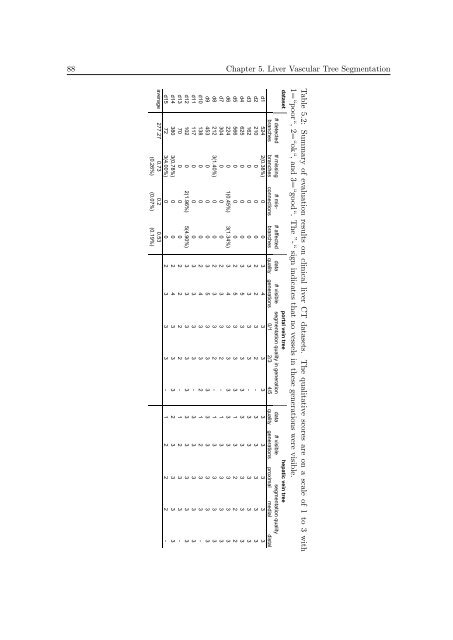
Table 5.2: Summary <strong>of</strong> evaluation results on cl<strong>in</strong>ical liver CT datasets. The qualitative scores are on a scale <strong>of</strong> 1 to 3 with<br />
1=“poor“, 2=“ok“, and 3=“good“. The ”-“ sign <strong>in</strong>dicates that no vessels <strong>in</strong> these generations were visible.<br />
dataset<br />
portal ve<strong>in</strong> tree hepatic ve<strong>in</strong> tree<br />
segmentation quality<br />
# detected # miss<strong>in</strong>g # mis- # affected data # visible segmentation quality <strong>in</strong> generation data # visible<br />
branches branches connections branches quality generations 0/1 2/3 4/5 quality generations proximal medial distal<br />
d1 524 2(0.38%) 0 0 3 4 3 3 3 3 3 3 3 3<br />
d2 210 0 0 0 2 2 3 2 - 3 3 3 3 3<br />
d3 162 0 0 0 3 3 3 3 - 3 3 3 3 3<br />
d4 625 0 0 0 3 5 3 3 3 3 3 3 3 3<br />
d5 566 0 0 0 2 5 3 3 3 1 3 2 2 2<br />
d6 224 0 1(0.45%) 3(1.34%) 3 4 3 3 3 3 3 3 3 3<br />
d7 304 0 0 0 2 3 3 2 - 1 3 3 3 3<br />
d8 212 3(1.40%) 0 0 2 3 3 2 - 1 3 3 3 3<br />
d9 453 0 0 0 3 5 3 3 3 3 3 3 3 3<br />
d10 138 0 0 0 2 4 3 3 2 1 2 3 3 -<br />
d11 117 0 0 0 3 3 3 3 - 3 3 3 3 3<br />
d12 102 0 2(1.96%) 5(4.90%) 3 3 3 3 3 3 3 3 3 3<br />
d13 70 0 0 0 2 2 2 2 - 1 2 3 3 -<br />
d14 380 3(0.78%) 0 0 2 4 3 3 3 2 3 3 3 3<br />
d15 72 3(4.00%) 0 0 2 3 3 3 - 1 2 2 2 -<br />
average 277.27 0.73 0.2 0.53<br />
(0.26%) (0.07%) (0.19%)