Segmentation of 3D Tubular Tree Structures in Medical Images ...
Segmentation of 3D Tubular Tree Structures in Medical Images ...
Segmentation of 3D Tubular Tree Structures in Medical Images ...

Create successful ePaper yourself
Turn your PDF publications into a flip-book with our unique Google optimized e-Paper software.
2.5. Experiments 37<br />
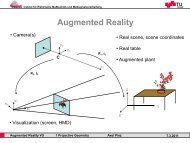
(a) 3d volume render<strong>in</strong>g<br />
100<br />
50<br />
1000<br />
500<br />
0<br />
0<br />
0 20 40 60 80 100 120 1400 20 40 60 80 100 120 140<br />
(b) 1d cross section show<strong>in</strong>g contrast<br />
(c) Response <strong>of</strong> Frangi’s method [44].<br />
5<br />
10<br />
5<br />
0<br />
0<br />
0 20 40 60 80 100 120 1400 20 40 60 80 100 120 140<br />
(d) Response <strong>of</strong> Krissian’s method [70]<br />
(e) Response <strong>of</strong> Pock’s method [114].<br />
20<br />
500<br />
10<br />
0<br />
0<br />
0 20 40 60 80 100 120 1400 20 40 60 80 100 120 140<br />
(f) Response <strong>of</strong> GVF-based tube detection<br />
with central medialness (Section 2.3.2).<br />
(g) Response <strong>of</strong> GVF-based tube detection<br />
with <strong>of</strong>fset medialness (Section 2.3.2).<br />
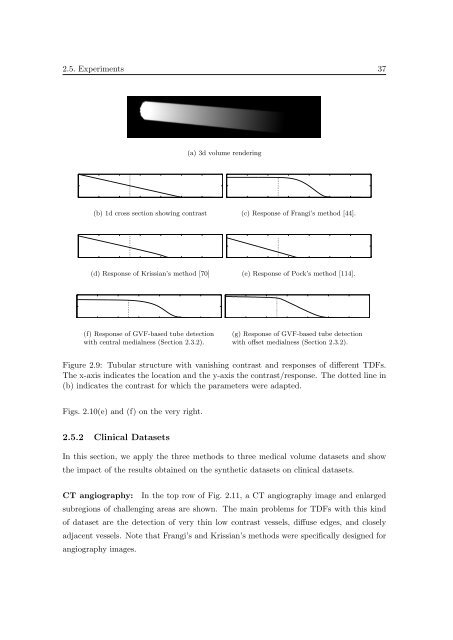
Figure 2.9: <strong>Tubular</strong> structure with vanish<strong>in</strong>g contrast and responses <strong>of</strong> different TDFs.<br />
The x-axis <strong>in</strong>dicates the location and the y-axis the contrast/response. The dotted l<strong>in</strong>e <strong>in</strong><br />
(b) <strong>in</strong>dicates the contrast for which the parameters were adapted.<br />
Figs. 2.10(e) and (f) on the very right.<br />
2.5.2 Cl<strong>in</strong>ical Datasets<br />
In this section, we apply the three methods to three medical volume datasets and show<br />
the impact <strong>of</strong> the results obta<strong>in</strong>ed on the synthetic datasets on cl<strong>in</strong>ical datasets.<br />
CT angiography: In the top row <strong>of</strong> Fig. 2.11, a CT angiography image and enlarged<br />
subregions <strong>of</strong> challeng<strong>in</strong>g areas are shown. The ma<strong>in</strong> problems for TDFs with this k<strong>in</strong>d<br />
<strong>of</strong> dataset are the detection <strong>of</strong> very th<strong>in</strong> low contrast vessels, diffuse edges, and closely<br />
adjacent vessels. Note that Frangi’s and Krissian’s methods were specifically designed for<br />
angiography images.