Segmentation of 3D Tubular Tree Structures in Medical Images ...
Segmentation of 3D Tubular Tree Structures in Medical Images ...
Segmentation of 3D Tubular Tree Structures in Medical Images ...

You also want an ePaper? Increase the reach of your titles
YUMPU automatically turns print PDFs into web optimized ePapers that Google loves.
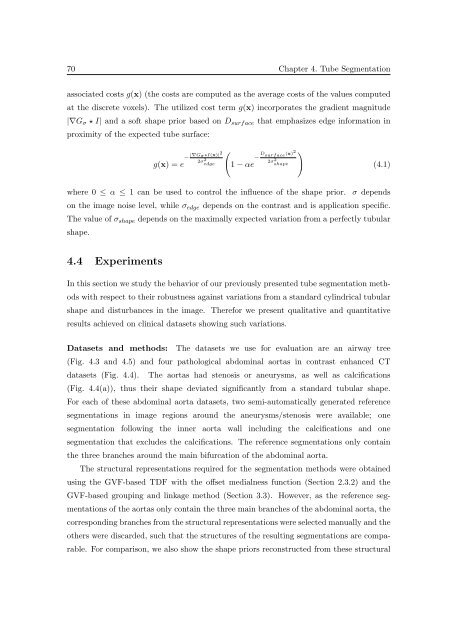
70 Chapter 4. Tube <strong>Segmentation</strong><br />
associated costs g(x) (the costs are computed as the average costs <strong>of</strong> the values computed<br />
at the discrete voxels). The utilized cost term g(x) <strong>in</strong>corporates the gradient magnitude<br />
|∇G σ ⋆ I| and a s<strong>of</strong>t shape prior based on D surface that emphasizes edge <strong>in</strong>formation <strong>in</strong><br />
proximity <strong>of</strong> the expected tube surface:<br />
g(x) = e − |∇Gσ⋆I(x)|2<br />
2σ<br />
edge<br />
2<br />
)<br />
(1 − αe − D surface (x)2<br />
2σ 2 shape<br />
(4.1)<br />
where 0 ≤ α ≤ 1 can be used to control the <strong>in</strong>fluence <strong>of</strong> the shape prior. σ depends<br />
on the image noise level, while σ edge depends on the contrast and is application specific.<br />
The value <strong>of</strong> σ shape depends on the maximally expected variation from a perfectly tubular<br />
shape.<br />
4.4 Experiments<br />
In this section we study the behavior <strong>of</strong> our previously presented tube segmentation methods<br />
with respect to their robustness aga<strong>in</strong>st variations from a standard cyl<strong>in</strong>drical tubular<br />
shape and disturbances <strong>in</strong> the image. Therefor we present qualitative and quantitative<br />
results achieved on cl<strong>in</strong>ical datasets show<strong>in</strong>g such variations.<br />
Datasets and methods: The datasets we use for evaluation are an airway tree<br />
(Fig. 4.3 and 4.5) and four pathological abdom<strong>in</strong>al aortas <strong>in</strong> contrast enhanced CT<br />
datasets (Fig. 4.4). The aortas had stenosis or aneurysms, as well as calcifications<br />
(Fig. 4.4(a)), thus their shape deviated significantly from a standard tubular shape.<br />
For each <strong>of</strong> these abdom<strong>in</strong>al aorta datasets, two semi-automatically generated reference<br />
segmentations <strong>in</strong> image regions around the aneurysms/stenosis were available; one<br />
segmentation follow<strong>in</strong>g the <strong>in</strong>ner aorta wall <strong>in</strong>clud<strong>in</strong>g the calcifications and one<br />
segmentation that excludes the calcifications. The reference segmentations only conta<strong>in</strong><br />
the three branches around the ma<strong>in</strong> bifurcation <strong>of</strong> the abdom<strong>in</strong>al aorta.<br />
The structural representations required for the segmentation methods were obta<strong>in</strong>ed<br />
us<strong>in</strong>g the GVF-based TDF with the <strong>of</strong>fset medialness function (Section 2.3.2) and the<br />
GVF-based group<strong>in</strong>g and l<strong>in</strong>kage method (Section 3.3). However, as the reference segmentations<br />
<strong>of</strong> the aortas only conta<strong>in</strong> the three ma<strong>in</strong> branches <strong>of</strong> the abdom<strong>in</strong>al aorta, the<br />
correspond<strong>in</strong>g branches from the structural representations were selected manually and the<br />
others were discarded, such that the structures <strong>of</strong> the result<strong>in</strong>g segmentations are comparable.<br />
For comparison, we also show the shape priors reconstructed from these structural