Segmentation of 3D Tubular Tree Structures in Medical Images ...
Segmentation of 3D Tubular Tree Structures in Medical Images ...
Segmentation of 3D Tubular Tree Structures in Medical Images ...

Create successful ePaper yourself
Turn your PDF publications into a flip-book with our unique Google optimized e-Paper software.
6.3. Evaluation and Results 103<br />
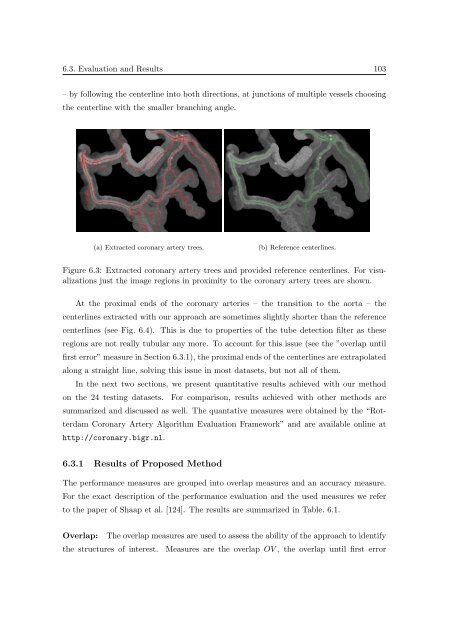
– by follow<strong>in</strong>g the centerl<strong>in</strong>e <strong>in</strong>to both directions, at junctions <strong>of</strong> multiple vessels choos<strong>in</strong>g<br />
the centerl<strong>in</strong>e with the smaller branch<strong>in</strong>g angle.<br />
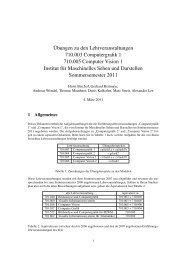
(a) Extracted coronary artery trees.<br />
(b) Reference centerl<strong>in</strong>es.<br />
Figure 6.3: Extracted coronary artery trees and provided reference centerl<strong>in</strong>es. For visualizations<br />
just the image regions <strong>in</strong> proximity to the coronary artery trees are shown.<br />
At the proximal ends <strong>of</strong> the coronary arteries – the transition to the aorta – the<br />
centerl<strong>in</strong>es extracted with our approach are sometimes slightly shorter than the reference<br />
centerl<strong>in</strong>es (see Fig. 6.4). This is due to properties <strong>of</strong> the tube detection filter as these<br />
regions are not really tubular any more. To account for this issue (see the ”overlap until<br />
first error” measure <strong>in</strong> Section 6.3.1), the proximal ends <strong>of</strong> the centerl<strong>in</strong>es are extrapolated<br />
along a straight l<strong>in</strong>e, solv<strong>in</strong>g this issue <strong>in</strong> most datasets, but not all <strong>of</strong> them.<br />
In the next two sections, we present quantitative results achieved with our method<br />
on the 24 test<strong>in</strong>g datasets. For comparison, results achieved with other methods are<br />
summarized and discussed as well. The quantative measures were obta<strong>in</strong>ed by the “Rotterdam<br />
Coronary Artery Algorithm Evaluation Framework” and are available onl<strong>in</strong>e at<br />
http://coronary.bigr.nl.<br />
6.3.1 Results <strong>of</strong> Proposed Method<br />
The performance measures are grouped <strong>in</strong>to overlap measures and an accuracy measure.<br />
For the exact description <strong>of</strong> the performance evaluation and the used measures we refer<br />
to the paper <strong>of</strong> Shaap et al. [124]. The results are summarized <strong>in</strong> Table. 6.1.<br />
Overlap: The overlap measures are used to assess the ability <strong>of</strong> the approach to identify<br />
the structures <strong>of</strong> <strong>in</strong>terest. Measures are the overlap OV , the overlap until first error