Segmentation of 3D Tubular Tree Structures in Medical Images ...
Segmentation of 3D Tubular Tree Structures in Medical Images ...
Segmentation of 3D Tubular Tree Structures in Medical Images ...

Create successful ePaper yourself
Turn your PDF publications into a flip-book with our unique Google optimized e-Paper software.
4.4. Experiments 73<br />
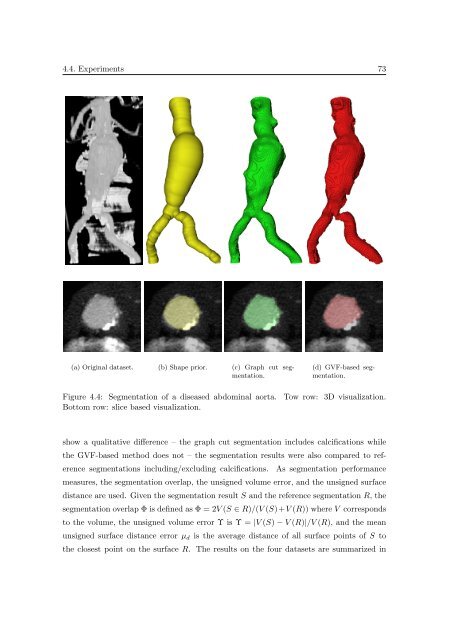
(a) Orig<strong>in</strong>al dataset. (b) Shape prior. (c) Graph cut segmentation.<br />
(d) GVF-based segmentation.<br />
Figure 4.4: <strong>Segmentation</strong> <strong>of</strong> a diseased abdom<strong>in</strong>al aorta.<br />
Bottom row: slice based visualization.<br />
Tow row: <strong>3D</strong> visualization.<br />
show a qualitative difference – the graph cut segmentation <strong>in</strong>cludes calcifications while<br />
the GVF-based method does not – the segmentation results were also compared to reference<br />
segmentations <strong>in</strong>clud<strong>in</strong>g/exclud<strong>in</strong>g calcifications. As segmentation performance<br />
measures, the segmentation overlap, the unsigned volume error, and the unsigned surface<br />
distance are used. Given the segmentation result S and the reference segmentation R, the<br />
segmentation overlap Φ is def<strong>in</strong>ed as Φ = 2V (S ∈ R)/(V (S)+V (R)) where V corresponds<br />
to the volume, the unsigned volume error Υ is Υ = |V (S) − V (R)|/V (R), and the mean<br />
unsigned surface distance error µ d is the average distance <strong>of</strong> all surface po<strong>in</strong>ts <strong>of</strong> S to<br />
the closest po<strong>in</strong>t on the surface R. The results on the four datasets are summarized <strong>in</strong>