- Page 1:
Graz University of Technology Insti
- Page 5 and 6:
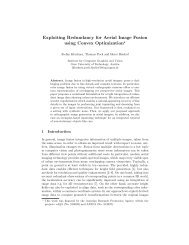
Abstract The segmentation of tubula
- Page 7 and 8:
Kurzfassung Die Segmentierung tubul
- Page 9:
Acknowledgements I am deeply gratef
- Page 13 and 14:
Contents 1 Introduction 1 1.0.1 Req
- Page 15:
CONTENTS xv 8 Conclusion and Outloo
- Page 18 and 19:
xviii LIST OF FIGURES 4.2 Shape pri
- Page 21:
List of Tables 3.1 Average centerli
- Page 24 and 25:
2 Chapter 1. Introduction (a) Porta
- Page 26 and 27:
4 Chapter 1. Introduction (a) Volum
- Page 28 and 29:
6 Chapter 1. Introduction (a) Inacc
- Page 30 and 31:
8 Chapter 1. Introduction features
- Page 32 and 33:
10 Chapter 1. Introduction 1.1.2 Di
- Page 34 and 35:
12 Chapter 1. Introduction Input vo
- Page 36 and 37:
14 Chapter 1. Introduction part: Me
- Page 38 and 39:
16 Chapter 1. Introduction in the l
- Page 40 and 41:
18 Chapter 2. Extraction of Tubular
- Page 42 and 43:
20 Chapter 2. Extraction of Tubular
- Page 44 and 45:
22 Chapter 2. Extraction of Tubular
- Page 46 and 47:
24 Chapter 2. Extraction of Tubular
- Page 48 and 49:
26 Chapter 2. Extraction of Tubular
- Page 50 and 51:
28 Chapter 2. Extraction of Tubular
- Page 52 and 53:
30 Chapter 2. Extraction of Tubular
- Page 54 and 55:
32 Chapter 2. Extraction of Tubular
- Page 56 and 57:
34 Chapter 2. Extraction of Tubular
- Page 58 and 59:
36 Chapter 2. Extraction of Tubular
- Page 60 and 61:
38 Chapter 2. Extraction of Tubular
- Page 62 and 63:
40 Chapter 2. Extraction of Tubular
- Page 64 and 65:
42 Chapter 2. Extraction of Tubular
- Page 66 and 67:
44 Chapter 2. Extraction of Tubular
- Page 68 and 69:
46 Chapter 2. Extraction of Tubular
- Page 70 and 71:
48 Chapter 3. Grouping and Linkage
- Page 72 and 73:
50 Chapter 3. Grouping and Linkage
- Page 74 and 75:
52 Chapter 3. Grouping and Linkage
- Page 76 and 77:
54 Chapter 3. Grouping and Linkage
- Page 78 and 79:
56 Chapter 3. Grouping and Linkage
- Page 80 and 81:
58 Chapter 3. Grouping and Linkage
- Page 82 and 83:
60 Chapter 3. Grouping and Linkage
- Page 84 and 85:
62 Chapter 3. Grouping and Linkage
- Page 86 and 87:
64 Chapter 3. Grouping and Linkage
- Page 88 and 89:
66 Chapter 4. Tube Segmentation Onl
- Page 90 and 91:
68 Chapter 4. Tube Segmentation obt
- Page 92 and 93:
70 Chapter 4. Tube Segmentation ass
- Page 94 and 95:
72 Chapter 4. Tube Segmentation (a)
- Page 96 and 97: 74 Chapter 4. Tube Segmentation Tab
- Page 99 and 100: Chapter 5 Liver Vascular Tree Segme
- Page 101 and 102: 5.2. Method 79 (a) MIP of the datas
- Page 103 and 104: 5.3. Evaluation and Results 81 5.3.
- Page 105 and 106: 5.3. Evaluation and Results 83 cent
- Page 107 and 108: 5.3. Evaluation and Results 85 (a)
- Page 109 and 110: 5.3. Evaluation and Results 87 (a)
- Page 111 and 112: 5.3. Evaluation and Results 89 (a)
- Page 113 and 114: 5.3. Evaluation and Results 91 (a)
- Page 115 and 116: 5.4. Discussion 93 results. Selle
- Page 117: 5.5. Conclusion 95 a prior to const
- Page 120 and 121: 98 Chapter 6. Coronary Artery Tree
- Page 122 and 123: 100 Chapter 6. Coronary Artery Tree
- Page 124 and 125: 102 Chapter 6. Coronary Artery Tree
- Page 126 and 127: 104 Chapter 6. Coronary Artery Tree
- Page 128 and 129: 106 Chapter 6. Coronary Artery Tree
- Page 131 and 132: Chapter 7 Airway Tree Segmentation
- Page 133 and 134: 7.2. Methods 111 shown in Fig. 7.1.
- Page 135 and 136: 7.2. Methods 113 Additionally, the
- Page 137 and 138: 7.3. Evaluation and Results 115 Gro
- Page 139 and 140: 7.3. Evaluation and Results 117 Tab
- Page 141 and 142: 7.4. Discussion 119 Figure 7.5: “
- Page 143 and 144: 7.5. Conclusion 121 Comparison to o
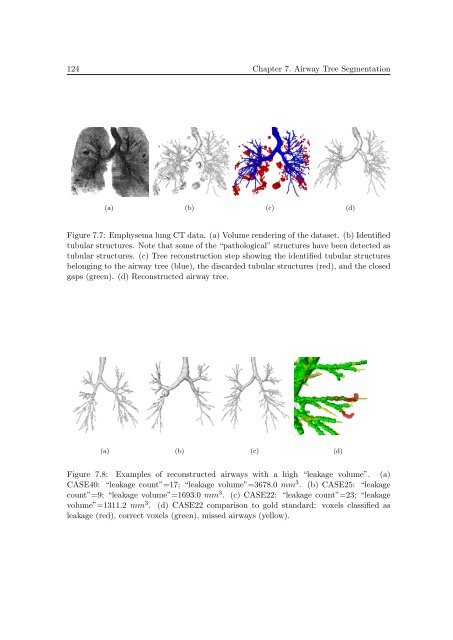
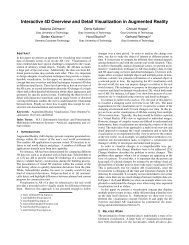
- Page 145: 7.5. Conclusion 123 Figure 7.6: Exa
- Page 149 and 150: 8.1. Conclusion 127 arteries - info
- Page 151: 8.2. Directions for Future Work 129
- Page 154 and 155: 132 Chapter A. List of Publications
- Page 157 and 158: BIBLIOGRAPHY 135 Bibliography [1] A
- Page 159 and 160: BIBLIOGRAPHY 137 [21] Choyke, P., Y
- Page 161 and 162: BIBLIOGRAPHY 139 [41] Florin, C., P
- Page 163 and 164: BIBLIOGRAPHY 141 [63] Kitslaar, P.
- Page 165 and 166: BIBLIOGRAPHY 143 [85] Lindeberg, T.
- Page 167 and 168: BIBLIOGRAPHY 145 [108] O’Donnell,
- Page 169 and 170: BIBLIOGRAPHY 147 [129] Schmugge, S.
- Page 171 and 172: BIBLIOGRAPHY 149 [150] van Bemmel,
- Page 173: BIBLIOGRAPHY 151 [171] Yi, J. and R