Segmentation of 3D Tubular Tree Structures in Medical Images ...
Segmentation of 3D Tubular Tree Structures in Medical Images ...
Segmentation of 3D Tubular Tree Structures in Medical Images ...

You also want an ePaper? Increase the reach of your titles
YUMPU automatically turns print PDFs into web optimized ePapers that Google loves.
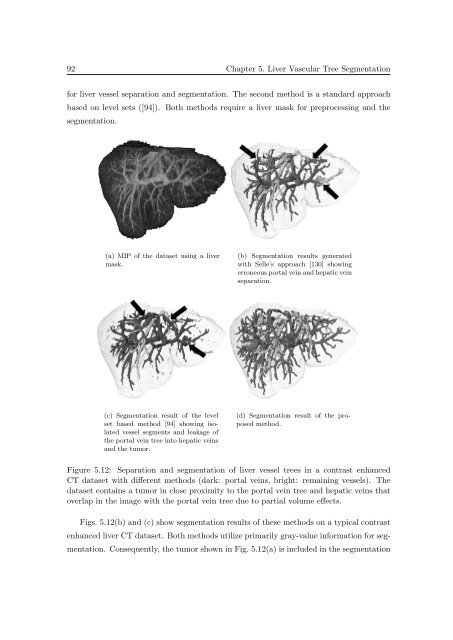
92 Chapter 5. Liver Vascular <strong>Tree</strong> <strong>Segmentation</strong><br />
for liver vessel separation and segmentation. The second method is a standard approach<br />
based on level sets ([94]). Both methods require a liver mask for preprocess<strong>in</strong>g and the<br />
segmentation.<br />
(a) MIP <strong>of</strong> the dataset us<strong>in</strong>g a liver<br />
mask.<br />
(b) <strong>Segmentation</strong> results generated<br />
with Selle’s approach [130] show<strong>in</strong>g<br />
erroneous portal ve<strong>in</strong> and hepatic ve<strong>in</strong><br />
separation.<br />
(c) <strong>Segmentation</strong> result <strong>of</strong> the level<br />
set based method [94] show<strong>in</strong>g isolated<br />
vessel segments and leakage <strong>of</strong><br />
the portal ve<strong>in</strong> tree <strong>in</strong>to hepatic ve<strong>in</strong>s<br />
and the tumor.<br />
(d) <strong>Segmentation</strong> result <strong>of</strong> the proposed<br />
method.<br />
Figure 5.12: Separation and segmentation <strong>of</strong> liver vessel trees <strong>in</strong> a contrast enhanced<br />
CT dataset with different methods (dark: portal ve<strong>in</strong>s, bright: rema<strong>in</strong><strong>in</strong>g vessels). The<br />
dataset conta<strong>in</strong>s a tumor <strong>in</strong> close proximity to the portal ve<strong>in</strong> tree and hepatic ve<strong>in</strong>s that<br />
overlap <strong>in</strong> the image with the portal ve<strong>in</strong> tree due to partial volume effects.<br />
Figs. 5.12(b) and (c) show segmentation results <strong>of</strong> these methods on a typical contrast<br />
enhanced liver CT dataset. Both methods utilize primarily gray-value <strong>in</strong>formation for segmentation.<br />
Consequently, the tumor shown <strong>in</strong> Fig. 5.12(a) is <strong>in</strong>cluded <strong>in</strong> the segmentation